Added to cart
 Tools & Software · Tool
Five per cent churn a month is forty-six per cent a year. Not sixty. Each month takes its share of whoever is still there, so the loss compounds on a shrinking base — and the wrong version is the one most plans are built on, because multiplying by twelve sounds prudent. Both figures are on […]
Download link by email · valid 30 days
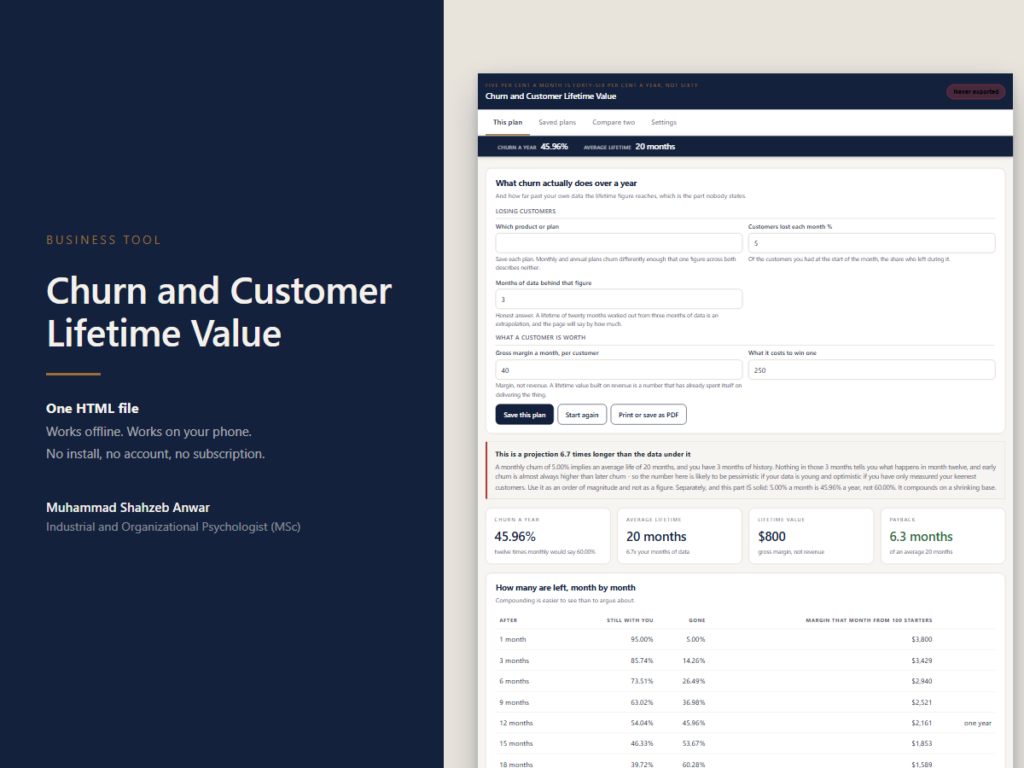
Five per cent churn a month is forty-six per cent a year. Not sixty. Each month takes its share of whoever is still there, so the loss compounds on a shrinking base — and the wrong version is the one most plans are built on, because multiplying by twelve sounds prudent.
Both figures are on the page, side by side, so the difference is something you can see rather than something you have to accept.
From that comes the average lifetime, and from the lifetime the value of a customer — on gross margin, not on revenue, because a lifetime value built on revenue is a number that has already been spent delivering the thing.
Then it does what almost no lifetime value calculation does: it tells you how far the answer reaches past your own data. A twenty-month lifetime worked out from three months of history is a projection nearly seven times longer than the evidence under it. Nothing in those three months says what happens in month twelve, and early churn is almost always higher than later churn, so the number can be badly wrong in either direction.
That is not a reason to avoid the figure. It is a reason to hold it as an order of magnitude rather than as a number, and the page says which parts are which: the compounding is exact arithmetic, the lifetime is a projection.
It does not predict which customers will leave. That needs data this page does not have, and a page that guessed would be guessing about named people.
Save as many versions as you like and put any two side by side, figure against figure, with the better one on each line marked and the difference in its own column. That screen is the one that decides things, and it is the part a free calculator cannot do at all. Monthly and annual plans churn differently enough that one figure across both describes neither.
One HTML file. No account, no subscription, no internet needed. Opens on Windows, Mac and Android; the readme explains the extra step on iPhone and iPad, where Apple blocks JavaScript in downloaded files and every tool of this kind is affected.
Everything lives in your browser on your device. Nothing is uploaded, which is why it works offline and why nobody else can see your figures — and it also means clearing your browsing data deletes it. The tool does not pretend otherwise: the header shows how long since your last export at all times, turns amber after three days and red after seven, and export is one click that produces a plain file you keep.
Please verify the product description for exact OS compatibility, but the vast majority of our web-based tools and digital utilities operate beautifully on any operating system.
No, this is a strict one-time purchase that unlocks lifetime access, including all future software updates and feature rollouts.
Post-purchase, you will receive an instant download link securely delivered to your email, alongside your activation license key if applicable.
We include rigorous, detailed documentation, and our responsive support team is on standby to assist you with any installation or configuration hurdles.
Added to cart
Your cart is empty
Browse Shop Tools & Software · Tool
 Tools & Software · Tool