Added to cart
 Tools & Software · Tool
A team split between strongly disagree and strongly agree, and a team where everybody picked the middle, produce exactly the same mean of three. They could not need more different responses, and the mean cannot tell them apart. This reports both the score and the shape. When the answers pile up at the two ends […]
Download link by email · valid 30 days
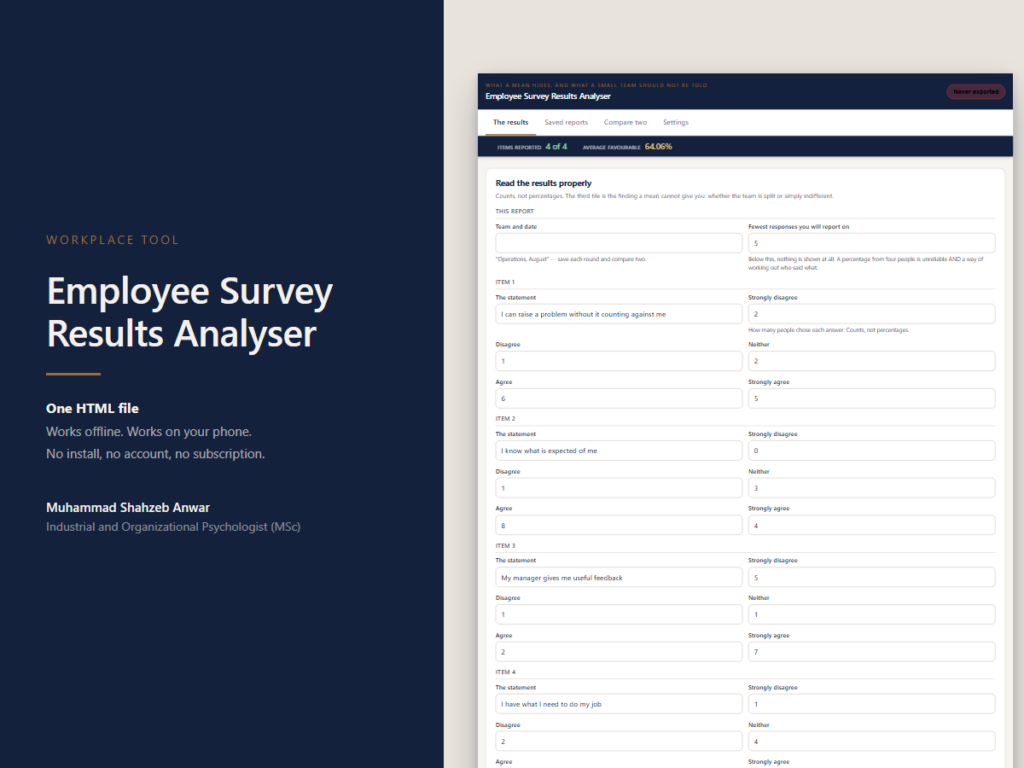
A team split between strongly disagree and strongly agree, and a team where everybody picked the middle, produce exactly the same mean of three. They could not need more different responses, and the mean cannot tell them apart.
This reports both the score and the shape. When the answers pile up at the two ends and the middle is nearly empty, it says so in those words — because a split is two groups having different experiences of the same place, and the useful question is which two. An indifferent team needs a reason; a split team needs finding out.
The second thing it does is refuse. Below the response threshold you set, no figure is shown at all — not a warning, not a caveat, nothing. Every survey guide says not to break a group down until people become identifiable, and a tool can simply decline instead of advising. A percentage from four people is unreliable, and in a small team it is also a way of working out who said what.
You enter counts, not percentages: how many people chose each answer. It needs the counts to know whether there are enough responses to report at all, and it does the percentages itself. No individual answers go into it and nothing leaves your browser.
Save as many versions as you like and put any two side by side, figure against figure, with the better one on each line marked and the difference in its own column. That screen is the one that decides things, and it is the part a free calculator cannot do at all. Save each round; the difference column is the only comparison worth making.
It is not a statistics package. It runs no significance test and will not tell you whether a change between two rounds is real, because that needs more than counts and a tool that implied otherwise would be worse than one that says so.
It sits beside The Employee Engagement Survey Pack and The Psychological Safety Audit, which are the documents: what to ask, why, and how to run it. This is what to do with the answers.
One HTML file. No account, no subscription, no internet needed. Opens on Windows, Mac and Android; the readme explains the extra step on iPhone and iPad, where Apple blocks JavaScript in downloaded files and every tool of this kind is affected.
Everything lives in your browser on your device. Nothing is uploaded, which is why it works offline and why nobody else can see your figures — and it also means clearing your browsing data deletes it. The tool does not pretend otherwise: the header shows how long since your last export at all times, turns amber after three days and red after seven, and export is one click that produces a plain file you keep.
A free companion to this tool: the Survivorship Bias Calculator, for whether a rise in the score is only the unhappy people having left. No sign-up.
Please verify the product description for exact OS compatibility, but the vast majority of our web-based tools and digital utilities operate beautifully on any operating system.
No, this is a strict one-time purchase that unlocks lifetime access, including all future software updates and feature rollouts.
Post-purchase, you will receive an instant download link securely delivered to your email, alongside your activation license key if applicable.
We include rigorous, detailed documentation, and our responsive support team is on standby to assist you with any installation or configuration hurdles.
Added to cart
Your cart is empty
Browse Shop Tools & Software · Tool
 Psychology Tools · Psychology