Added to cart
 Psychology Tools · Psychology
Eight months averaging 43.75. The best of them was 52. Expect about 48 next month. Nothing has to happen for that fall. Part of what made 52 stand out was the part that repeats and part was the part that does not, and only the first part is expected again. That is the whole of […]
Download link by email · valid 30 days
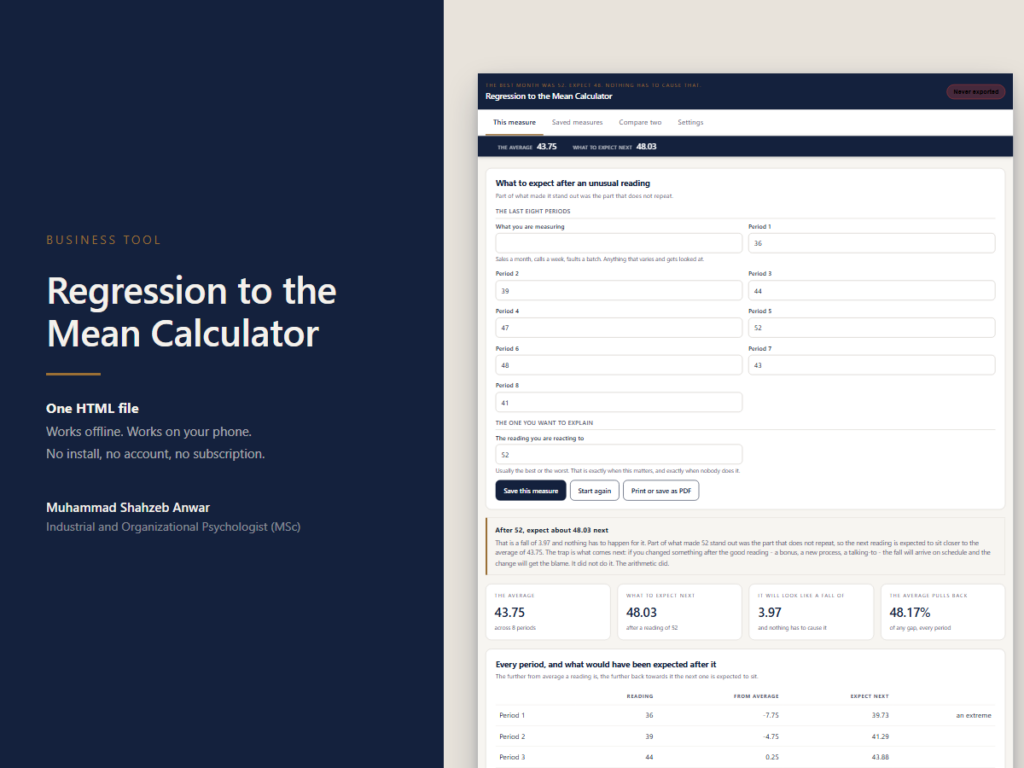
Eight months averaging 43.75. The best of them was 52.
Expect about 48 next month. Nothing has to happen for that fall.
Part of what made 52 stand out was the part that repeats and part was the part that does not, and only the first part is expected again. That is the whole of regression to the mean: not a force, not the universe balancing out, just what an imperfect correlation between one period and the next actually means.
The trap is what happens next. If you changed something after the good month — a bonus, a new process, a talking-to — the fall arrives on schedule and the change gets the blame. It did not do it. The arithmetic did.
And it runs the other way, which is worse. Intervene after a bad month and the improvement arrives on its own. The intervention gets the credit, goes into the handbook, and gets used again on the next bad month with the same apparent success. That is how useless practices survive for years while useful ones get dropped.
The page works from your own readings rather than an assumed correlation: put eight periods in and it measures how much one tells you about the next, then applies that to whichever reading you are reacting to.
The table shows every period, how far it sat from the average, and what would have been expected after it — which is the version worth showing somebody who is about to act on last month.
It is not a forecast. It says where a reading is expected to sit relative to the average, and it knows nothing about your season, your new contract, or the thing that is genuinely about to happen. A trend line it is not.
Eight readings is thin, and the page says so. The correlation it rests on is itself estimated from your numbers, and from eight of them it is a noisy estimate of a noisy thing. The direction of the answer is reliable; the exact figure is not.
Save as many versions as you like and put any two side by side, figure against figure, with the better one on each line marked and the difference in its own column. That screen is the one that decides things, and it is the part a free calculator cannot do at all. Two measures side by side is how you find out which of them is worth reacting to at all.
One HTML file. No account, no subscription, no internet needed. Opens on Windows, Mac and Android; the readme explains the extra step on iPhone and iPad, where Apple blocks JavaScript in downloaded files and every tool of this kind is affected.
Everything lives in your browser on your device. Nothing is uploaded, which is why it works offline and why nobody else can see your figures — and it also means clearing your browsing data deletes it. The tool does not pretend otherwise: the header shows how long since your last export at all times, turns amber after three days and red after seven, and export is one click that produces a plain file you keep.
Try the arithmetic first. The free Regression to the Mean Calculator runs the same calculation with no sign-up. The paid version does more; it does not compute a different answer.
Please verify the product description for exact OS compatibility, but the vast majority of our web-based tools and digital utilities operate beautifully on any operating system.
No, this is a strict one-time purchase that unlocks lifetime access, including all future software updates and feature rollouts.
Post-purchase, you will receive an instant download link securely delivered to your email, alongside your activation license key if applicable.
We include rigorous, detailed documentation, and our responsive support team is on standby to assist you with any installation or configuration hurdles.
Added to cart
Your cart is empty
Browse Shop Tools & Software · Tool
 Tools & Software · Tool