Added to cart
 Tools & Software · Tool
A candidate scores 112. Another scores 118. On a test with a reliability of .85 and a spread of 15, those are the same score. They have to be 16.1 points apart before the difference can be called real, and the reason is not obvious even to people who use tests every week: each score […]
Download link by email · valid 30 days
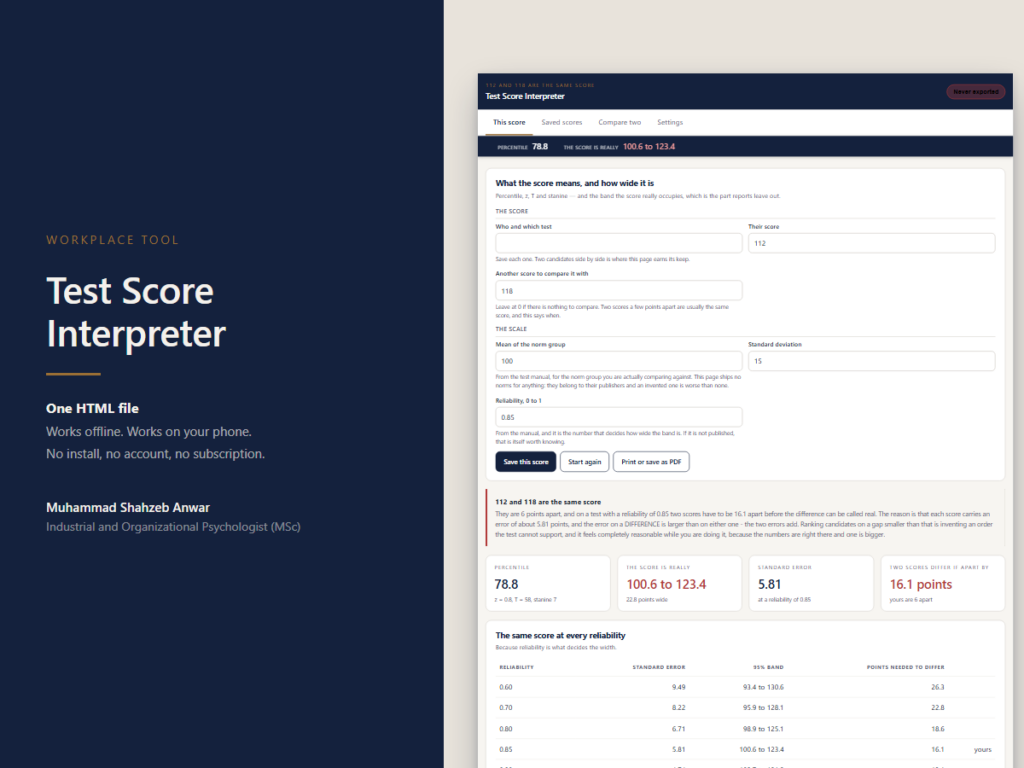
A candidate scores 112. Another scores 118. On a test with a reliability of .85 and a spread of 15, those are the same score.
They have to be 16.1 points apart before the difference can be called real, and the reason is not obvious even to people who use tests every week: each score carries a measurement error of about 5.8 points, and the error on a DIFFERENCE is larger than the error on either score, because the two errors add.
Ranking candidates on a gap smaller than that is inventing an order the test cannot support. It feels completely reasonable while you are doing it, because the numbers are right there on the report and one of them is bigger.
So this page gives a score as a band rather than as a point: the percentile, the z, the T score and the stanine, and then the range the score actually occupies. On the seeded figures a 112 runs from 100.6 to 123.4 — nearly twenty-three points wide, and all of that width comes from the reliability.
The table shows the same score at every reliability from .60 to .95, with the band and the difference threshold at each, so you can see exactly what the reliability is buying. A report that prints one number and no band is quietly claiming a precision the test does not have.
It ships no norms for any published test. The mean, the spread and the reliability come from the manual for the group you are actually comparing against — which may not be the group in the front of the book — and an invented norm would look exactly as convincing as a real one. That is the reason there is not one here.
And it says the thing that gets forgotten: reliable is not valid. A test can measure something very consistently and have that something be unrelated to the job. This page speaks only to the first.
Save as many versions as you like and put any two side by side, figure against figure, with the better one on each line marked and the difference in its own column. That screen is the one that decides things, and it is the part a free calculator cannot do at all. Two candidates side by side is where this earns its keep.
One HTML file. No account, no subscription, no internet needed. Opens on Windows, Mac and Android; the readme explains the extra step on iPhone and iPad, where Apple blocks JavaScript in downloaded files and every tool of this kind is affected.
Everything lives in your browser on your device. Nothing is uploaded, which is why it works offline and why nobody else can see your figures — and it also means clearing your browsing data deletes it. The tool does not pretend otherwise: the header shows how long since your last export at all times, turns amber after three days and red after seven, and export is one click that produces a plain file you keep.
A free companion to this tool: the Range Restriction Calculator, for why a validity study on your own hires understates the test. No sign-up.
Please verify the product description for exact OS compatibility, but the vast majority of our web-based tools and digital utilities operate beautifully on any operating system.
No, this is a strict one-time purchase that unlocks lifetime access, including all future software updates and feature rollouts.
Post-purchase, you will receive an instant download link securely delivered to your email, alongside your activation license key if applicable.
We include rigorous, detailed documentation, and our responsive support team is on standby to assist you with any installation or configuration hurdles.
Added to cart
Your cart is empty
Browse Shop Tools & Software · Tool
 Tools & Software · Tool