

A librarian loves her job, believes in it, and tells people proudly where she works. Then a resident threatens her at the desk, and the pride does not make the threat smaller. That is the uncomfortable picture in Harvard’s first Public Servant Pulse survey: people who joined to serve, who still believe in the mission, and who are being harassed at work in large numbers. Workplace harassment does not spare mission-driven people, and mission is not a protection plan.
I am an Industrial and Organizational Psychologist in Karachi, and I write about what workplace research actually shows, including its limits. This guide is built on a survey that is unusually clear about both. The Public Servant Pulse, from The People Lab at Harvard Kennedy School, surveyed United States state and local government employees — not workers in general, not workers in any other country, and not private-sector staff. Its percentages describe that population, in that country, at that time. Within that scope, the finding is stark: more than one in three employees reported harassment in the past year, and harassment was strongly associated with worse workforce health. The survey is observational, so it cannot prove that harassment caused those worse outcomes. But the pattern, the size of the sample, and the detail about who is most exposed make it impossible to dismiss with a slogan about purpose.
“Mission explains why people stay. It does not explain why they are safe, and it must never be used as an excuse for leaving them unsafe.” — Workplace Psychology Analysis, ShahzebSpeaks
🔬 Chapter 1: The short answer — workplace harassment and mission
The short answer is that high mission and high harassment can exist in the same workforce at the same time. In the Pulse survey, two-thirds of respondents believed the public sector is the best place to make an impact, and 63% said they were motivated to join by a desire to serve the public or make a difference. At the same time, 35% reported experiencing harassment at work — defined as being bullied, threatened, attacked, or harassed — at least once in the past 12 months. Mission, in other words, describes why people chose the work. It says nothing reliable about how they are treated while doing it.
That distinction matters because managers often use mission as a reassurance. “We are here for a cause” is offered, implicitly or explicitly, as if it balances a difficult encounter, a hostile resident, or a bullying supervisor. The Pulse data do not support that trade. Overall workplace satisfaction scored 70 out of 100, engagement 76 out of 100, and 80% of employees at least somewhat agreed they were proud to tell others where they work. Those are respectable figures. They sit alongside 40% experiencing at least one symptom of burnout and 27% intending to leave within 12 months. A workforce can be proud and exhausted, motivated and mistreated, committed and already planning its exit. Any manager who reads only the pride figure will miss the risk.
📋 Chapter 2: What the survey actually measured — and what it did not
The Pulse is an annual, nationally representative survey of state and local government employees in the United States. In its inaugural year, 4,792 public servants took part: 320 from state government, 1,621 from county government, and 2,851 from city or other local government. They came from 857 unique cities and 475 unique counties, across all 50 states, Washington, D.C., and Puerto Rico. Results are weighted to reflect the national population of state and local public servants, giving a weighted sample of 3,976 respondents. That weighting matters: the headline percentages are estimates for that population, not a raw count of everyone who answered.
The survey measures five workforce health indicators: workplace satisfaction, employee engagement, organisational pride, burnout, and intent to leave. It also asks about workplace relationships, job conditions, innovation and red tape, and harassment. Harassment is self-reported experience, not a legal finding. A respondent who says they were bullied, threatened, attacked, or harassed is reporting their experience; the survey does not adjudicate whether each incident would meet a legal definition. That is a strength and a limit. It captures harm that never reaches a formal complaint, and it cannot, by itself, classify incidents by law.
The most important limit is stated on the results page itself, and this guide repeats it because it governs everything that follows: “Because Public Servant Pulse data are observational, we cannot determine whether employees’ workplace experiences cause differences in workforce health.” Harassment is “strongly associated” with worse outcomes in the survey’s language. Association is not causation. People who are harassed may also work in under-resourced teams, or in roles with more public contact, and those factors may contribute too. What the survey does establish is that harassment is common, that it clusters in particular roles and groups, and that it travels with worse health indicators. That is enough to act on, without overstating what the design can prove.
📊 Chapter 3: The numbers that should stop a manager mid-sentence
Start with frequency. Thirty-five percent of employees reported harassment at least once in the past year. Twenty-nine percent experienced it at least a few times, and 9% monthly or more. Harassment, in this workforce, is not a rare event involving a few people. For nearly one in ten, it is a recurring feature of the job. A manager who treats a single report as an isolated incident should ask, on these figures, whether the reporting system is catching a pattern or only its loudest instance.
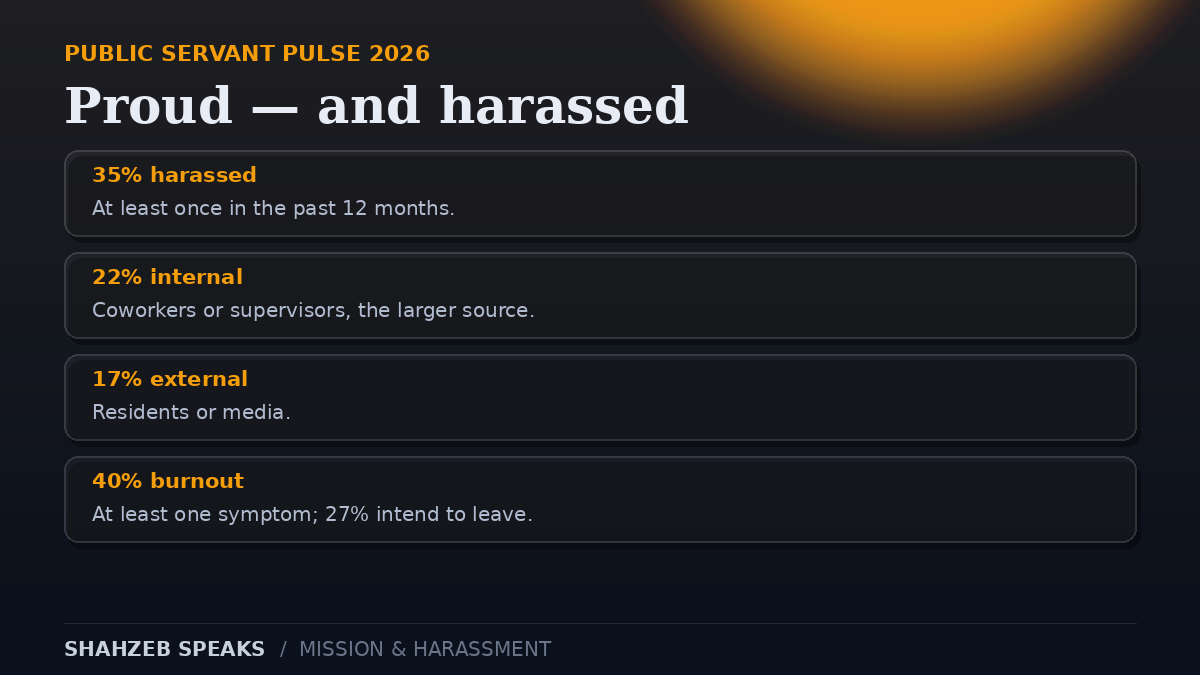
| Measure | Result | What it means |
|---|---|---|
| Harassed at least once, past 12 months | 35% | More than one in three employees |
| Harassed at least a few times | 29% | Not a one-off for most who report it |
| Harassed monthly or more | 9% | A recurring condition for nearly one in ten |
| Internal sources (coworkers, supervisors) | 22% | The risk inside the team is larger than outside it |
| External sources (residents, media) | 17% | Public-facing work carries its own exposure |
| At least one burnout symptom | 40% | Exhaustion is the dominant symptom (34%) |
| Intend to leave within 12 months | 27% | More than one in four are already looking at the door |
The source split corrects a common assumption. Public debate about abuse of public servants tends to focus on angry residents and hostile media. Those sources matter: 17% reported external harassment. But internal sources were reported more often, at 22%. Employees could report both, so the two figures do not add to 35%. The point stands regardless: the largest reported source of harassment is inside the workplace, from coworkers or supervisors. A strategy that only trains staff to handle difficult members of the public, while leaving team behaviour untouched, addresses the smaller reported source and ignores the larger one.
Burnout sits beside harassment, not instead of it. Forty percent reported at least one symptom of burnout, driven mainly by emotional exhaustion: 34% at least somewhat agreed they felt exhausted at the thought of another day at work, while 17% agreed or strongly agreed. Depersonalisation, feeling disconnected from the work, was reported by 18% at least somewhat. Only 5% at least somewhat agreed they could not manage the demands of the job well. That pattern suggests people are not saying the work is impossible. They are saying it is draining, and that the drain is emotional rather than purely a matter of workload. Harassment, by its nature, is an emotional drain. It is plausible that it contributes to exhaustion; the survey design does not prove that link, but it makes the link worth investigating rather than dismissing.
👥 Chapter 4: Who is most exposed — frontline staff, women, and the smallest group
Harassment is not spread evenly. Frontline employees were 16 percentage points more likely to report harassment than non-frontline employees. Internal harassment was similarly common across the two groups, but external harassment was substantially higher among frontline staff. That is the expected pattern for public-facing work, and it has a practical consequence: the people with the least control over who walks through the door carry the most exposure to the public. If protection is designed for office-based staff and then extended, as an afterthought, to frontline roles, it will fail where the risk is highest.
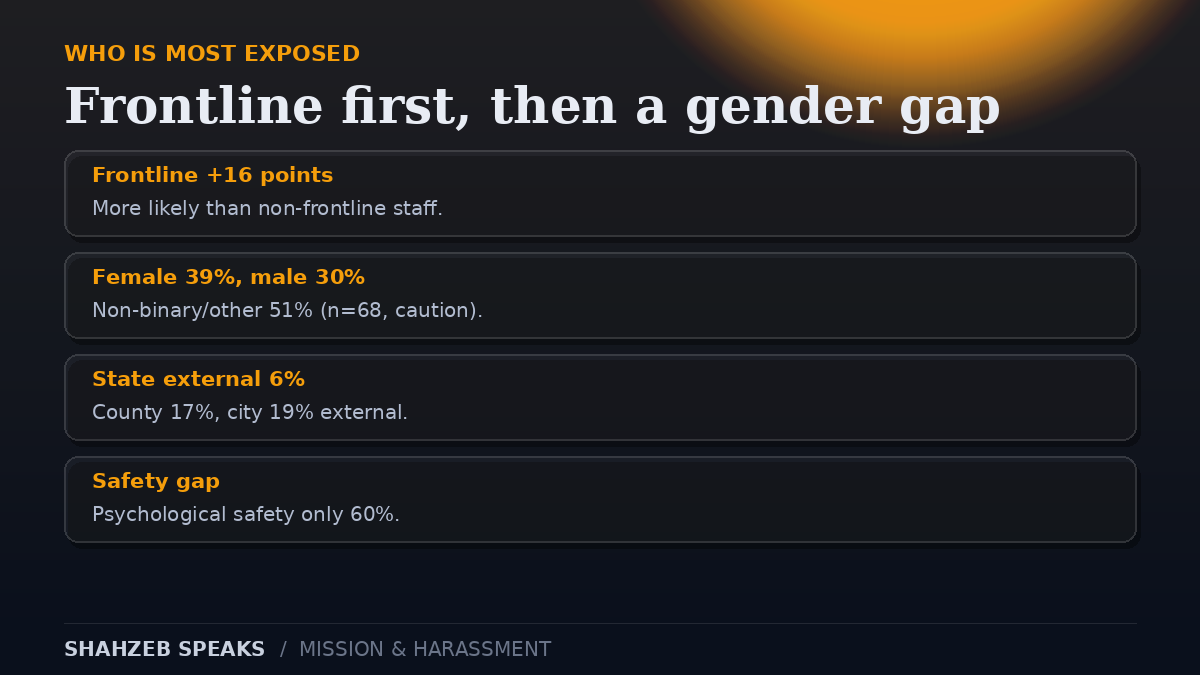
By gender, 39% of female employees reported harassment, compared with 30% of male employees. Non-binary or other gender employees reported the highest rate, at 51%, but the survey itself warns that this group numbered only 68 people in the sample, so the finding should be interpreted with caution. The honest way to report that figure is to report both parts together: the rate is striking, and the sample is small. Either part alone misleads. A small sample does not make the experience of those 68 people unimportant; it means the precise national rate for that group is uncertain. A manager does not need a precise national rate to take a report seriously.
Level of government matters too, mainly through external harassment. State government employees reported less harassment overall than city and county employees, and the difference appears to be driven by external sources: 6% of state employees reported external harassment, compared with 17% of county employees and 19% of city employees. State employees were only 6.5% of the sample (252 people), so comparisons involving that group also need caution. The pattern is still useful. Work that puts staff face to face with residents, in libraries, permitting offices, clinics, and streets, is work where the public is both the purpose and a source of risk. That dual role is the core tension of public service, and it cannot be resolved by telling staff to be more resilient.
🧠 Chapter 5: Why mission can hide harm — three mechanisms, stated as hypotheses
The Pulse survey does not test why mission and harassment coexist, so this chapter is careful. It offers three mechanisms that fit the data and the wider literature, labelled as hypotheses, not as findings from this survey. A manager who treats them as proven causes will overreach. A manager who ignores them will miss how mission can be misused.
First, mission can reframe harm as the price of the work. When a job is described as a calling, a difficult encounter can be recast as something the employee should absorb, because the cause matters more than their comfort. One Pulse respondent, a county zoning and permitting employee, described a loss of trust and a feeling that their integrity was “almost always called into question”, with regular assertions that they were “paid off”. That is not a complaint about hard work. It is a complaint about being treated as corrupt for doing a public job. If the culture answers that complaint with “this is public service”, it has told the employee that mistreatment is part of the role description. It is not.
Second, mission can delay exit, which hides the cost. People who believe in the work will tolerate more before leaving, and their tolerance can be read, wrongly, as evidence that conditions are acceptable. The Pulse shows 27% intending to leave within 12 months, with 20% unsure. That is a large figure for a workforce that is, by its own account, mission-driven. It suggests that for many, tolerance has already run out, or is close to running out. Retention, in that light, is not proof of health. It may be proof that people stayed longer than they should have, and then left anyway.
Third, mission can concentrate attention on the public and away from the team. Leaders who focus on residents, outcomes, and service delivery may under-invest in the internal relationships that the survey links most closely to health. The Pulse relationship figures are revealing here. Belonging was reported by 77%, an effective supervisor relationship by 81%, and cooperative teams by 83%. But only 60% said it is safe to take a risk on their team, and while 68% felt understood by their supervisor and 72% by coworkers, only 49% felt understood by department leadership and 20% by government leadership. The gap between the team and the top is wide. A workforce can feel supported by the people beside it and unheard by the people above it, and that gap is where harassment policies either work or fail.
The wider literature supports taking harassment seriously as a health matter, without proving the Pulse pattern. A meta-analysis by Nielsen and Einarsen (2012), pooling 66 samples with 77,721 people, found bullying associated with mental and physical health problems, post-traumatic stress symptoms, burnout, increased intentions to leave, and reduced job satisfaction and organisational commitment. A longitudinal analysis in the same paper, with 62,916 people, found bullying influenced mental health problems over time. A Swedish evidence map from May 2026, reviewing 19 systematic reviews, found workplace bullying, sexual harassment, discrimination, threats, and violence associated with depression, anxiety, burnout, and post-traumatic stress, while warning that heterogeneity precludes firm conclusions about magnitude. The evidence, taken together, says harassment is a health-relevant exposure, not a matter of hurt feelings. It does not say that any single survey proves causation.
🛠️ Chapter 6: What to fix first — a manager’s order of work
If the largest reported source is internal, the first fix is internal. That means a reporting route that does not run through the person accused, a named person outside the team who can receive reports, and a visible record of what happened after a report. “We take this seriously” is not a record. A date, a decision, and a follow-up with the person who reported are a record. Staff who have seen a previous report disappear will not file the next one, and the survey will then undercount the problem while the problem continues.
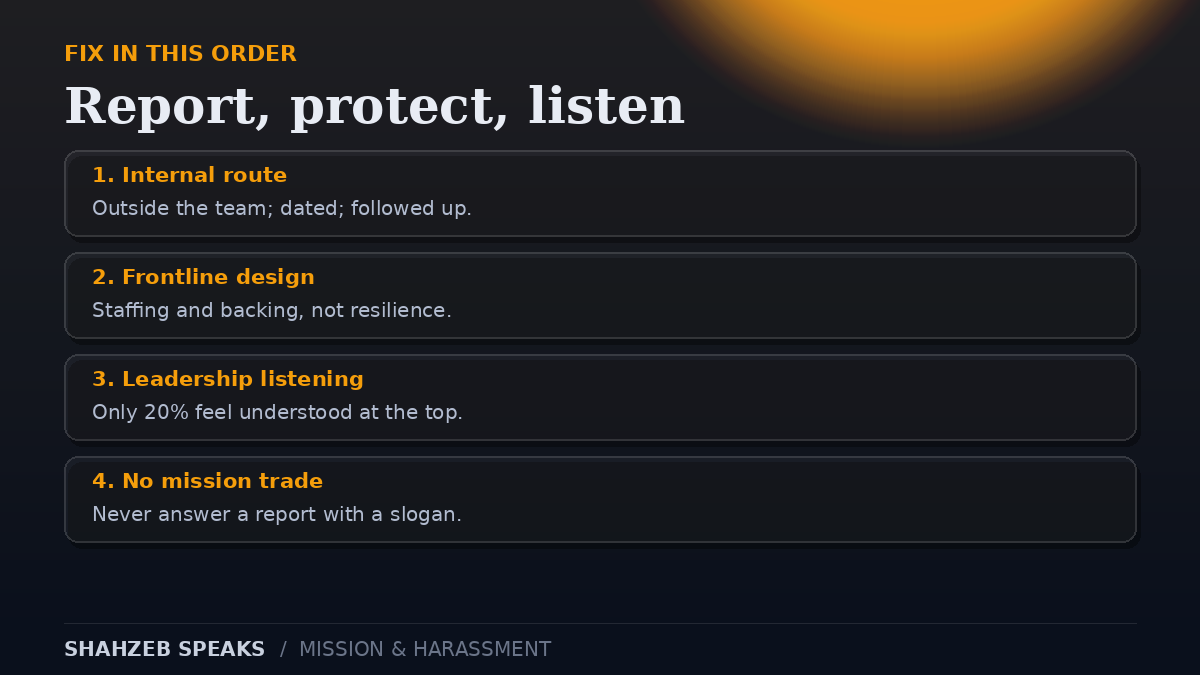
Second, protect frontline work as a designed risk, not as a personal failing. That includes staffing levels that do not leave one person alone with a hostile queue, a clear rule that abusive behaviour ends the interaction, and a supervisor who will back that rule in the moment. It also includes recording external incidents, so that a pattern at one counter, clinic, or office is visible as a pattern, not as a series of unrelated bad days. The Pulse finding that frontline staff carry 16 points more harassment is a staffing and design finding, not a resilience finding.
Third, close the leadership listening gap. Only 20% of employees felt understood by their government leadership, against 72% who felt understood by coworkers. Leaders do not need to agree with every complaint to be understood as listening. They need to show, in writing and in decisions, what they heard and what changed. A quarterly note that says “you told us X, we changed Y, we have not yet solved Z” does more for trust than a mission statement repeated at an all-staff meeting. Mission statements are cheap. Changed rotas, changed reporting routes, and changed responses to abusive behaviour are the evidence staff actually weigh.
Fourth, stop using mission as compensation. Do not answer a harassment report with a reminder of the cause, a story about sacrifice, or a suggestion that the employee should be tougher because the work matters. Those responses teach staff that reporting is disloyal. Instead, separate the two conversations completely: one conversation is about the incident, the support, and the action. Another, later conversation can be about the mission, the pride, and the future. Merging them contaminates both.
There is also a wider, independent reason to take culture and safety seriously, beyond this one survey. Gallup’s American Job Quality Study 2026, summarised in secondary coverage, found only 41% of all United States workers and 40% of employees in a “quality job”, unchanged from 2025. Employees in non-quality jobs had 3.4 times the odds of planning to leave, and workplace culture and safety — a safe, respectful environment free from discrimination and harassment — had the strongest link to intent to leave among the five dimensions, at 3.1 times the odds, ahead of growth, pay, and voice. That is a different survey, with a different definition, and it should not be merged with Pulse figures. Its message, however, points the same way: when people leave, the first thing to examine is not the pay scale. It is whether the workplace feels safe and respectful.
⚠️ Chapter 7: What this survey cannot tell you — and what to do about that
Three limits deserve plain statement. First, scope: Pulse covers United States state and local government employees. It does not describe private-sector workers, federal workers, or workers in other countries. A reader in Karachi, London, or Nairobi should take the mechanism seriously — mission does not guarantee safety anywhere — but should not quote 35% as a rate for their own workforce. Second, design: the survey is observational and cross-sectional for these results, so it cannot show that harassment caused burnout or intent to leave, only that they travel together. Third, measurement: harassment is self-reported experience, not a legal classification, and the survey does not, in the results page checked, give fieldwork dates or a breakdown of harassment types beyond the internal/external split.
None of those limits is a reason to wait. A manager does not need a causal proof to fix a reporting route, to staff a frontline counter safely, or to stop answering complaints with mission slogans. Those actions are justified by the reports themselves, by the duty of care an employer owes staff, and by the wider evidence that bullying and harassment are associated with health harm. What the limits do forbid is a stronger claim: that this survey proves mission causes harm, or that fixing harassment will, by itself, restore engagement to a specific level. Honest reporting keeps the claim at the size of the evidence, and lets the action be larger than the claim.
❓ Questions I am asked most often
Does mission protect workers from harassment?
No, on this evidence. In Harvard’s Public Servant Pulse, 63% of US state and local employees were motivated by a desire to serve, and two-thirds called the public sector the best place to make an impact, yet 35% reported harassment in the past year. Mission describes why people joined. It does not describe how they are treated.
How common is workplace harassment in the Pulse survey?
Thirty-five percent reported harassment at least once in 12 months, 29% at least a few times, and 9% monthly or more. Internal sources (22%) were reported more often than external sources (17%), and employees could report both. These figures cover US state and local public servants only.
Who is most likely to report harassment?
Frontline employees, who were 16 percentage points more likely to report it than non-frontline staff, mainly through external harassment. Women reported 39%, men 30%, and non-binary or other gender employees 51%, but that last group numbered only 68 people, so the precise rate is uncertain.
Does harassment cause burnout?
The Pulse survey cannot prove causation, because its data are observational. It shows harassment strongly associated with worse workforce health, and 40% of employees reported at least one burnout symptom. Wider meta-analytic evidence links bullying with burnout and mental health problems over time, but the Pulse result itself is an association.
What should a manager do first?
Fix the internal reporting route, because internal sources were the largest reported source. Give staff a route outside their own team, record the date and the outcome, and follow up with the person who reported. Then design frontline protection and stop answering reports with mission slogans.
Can I quote 35% for my own organisation?
No. The 35% figure is for US state and local government employees in the Pulse survey. Use it as a warning that mission-driven workforces are not exempt, and measure your own workforce instead of borrowing another country’s rate.
📬 Has mission ever been used to dismiss your experience?
Tell me what was said, and what would have helped instead. Contact me and name the response that closed the conversation, and the one that would have opened it.
For the broader field behind this guide, see my homepage on industrial psychology in Pakistan, and for related reading, see toxic workplace signs and psychological safety at work.
Sources
- Harvard Kennedy School, The People Lab (2026). Public Servant Pulse: Results. Public Servant Project.
- Public Sector HR Association (2026). Survey: High Rates of Burnout and Harassment Among State and Local Government Workers. 2 November 2026.
- Gallup, Jobs for the Future, The Families and Workers Fund (2026). The American Job Quality Study: 2026 State of the U.S. Labor Force (via secondary summary, Workplace Peace Institute, 2026).
- Nielsen, M. B., & Einarsen, S. (2012). Outcomes of exposure to workplace bullying: A meta-analytic review. Work & Stress, 26(4), 309-332.
- Swedish Agency for Health Technology Assessment and Assessment of Social Services (SBU) (2026). Workplace harassment, and violence or threats and its associations with mental ill health: An Evidence Map (summary).