
Reliability in psychological testing is the consistency of test scores: whether a test gives similar results over time, across forms, across items and across raters. The four main types are test-retest, parallel (alternate) forms, internal consistency (split-half, KR-20, Cronbach’s alpha, 1951) and inter-rater reliability. The standard error of measurement turns reliability into a score band.
This page is for psychology and HRM students preparing for exams on psychological testing, and for thesis students who must report Cronbach’s alpha and explain what it means. It covers the idea behind reliability, the four types with formulas and worked examples, the standard error of measurement, reliability vs validity in a table, a 10-mark answer plan and practice MCQs. Where you need to calculate something, it links to a free calculator on this site.
Reliability belongs to the personnel psychology part of the course, because every selection test and appraisal form must be reliable before it can be useful. See the personnel psychology notes for the full map.
What is reliability? The true score idea
Classical test theory says every observed score (X) has two parts: a true score (T), the score the person would get with perfect measurement, and error (E), the random push up or down from things like tiredness, a noisy room, lucky guesses or an ambiguous item. So X = T + E.
Reliability is the share of the differences between people’s observed scores that comes from true differences rather than error. A reliability of .85 means about 85% of the score variance is true-score variance and 15% is error. Reliability runs from 0 (all error) to 1 (no error), and it is usually reported as a correlation-type coefficient.
An everyday example: a weighing scale at a pharmacy that shows 70 kg, then 74 kg, then 68 kg for the same person in five minutes is unreliable. You cannot use it to decide anything. A selection test that ranks candidates differently every time it is given is just as useless, however good its items look.
The 4 types of reliability
1. Test-retest reliability (stability)
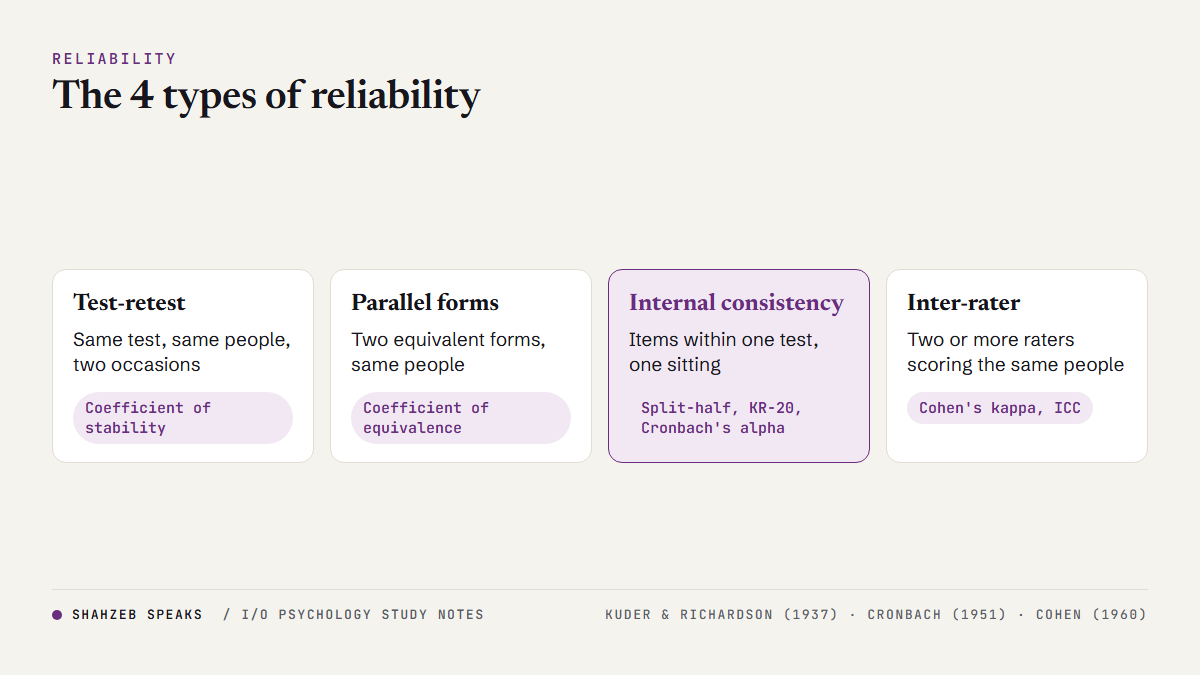
Give the same test to the same people twice, with a gap, and correlate the two sets of scores. The result is the coefficient of stability. It answers: are scores stable over time?
The gap matters. Too short, and people remember their answers, so the correlation is too high. Too long, and real change (training, growing up, a new job) lowers it, even though the test is fine. Test-retest suits stable traits such as cognitive ability or personality. It does not suit states that are meant to change, such as mood or stress this week.
2. Parallel forms (alternate forms) reliability (equivalence)
Build two versions of the test with different items of the same content and difficulty (Form A and Form B), give both to the same people and correlate the scores. The result is the coefficient of equivalence. It answers: do the two forms measure the same thing equally well?
Parallel forms are useful when a test is given many times, such as a bank’s numerical test used in every recruitment round, so that candidates who retake it cannot simply remember answers. The difficulty is that writing truly parallel forms is hard and doubles the work.
3. Internal consistency reliability
Internal consistency asks whether the items within one test hang together, all measuring the same thing. It needs only one test, given once, which is why it is the most reported type in theses.
Split-half reliability. Split the test into two halves (often odd-numbered vs even-numbered items), score each half and correlate them. Because each half is only half as long as the full test, this correlation underestimates the full test’s reliability. The Spearman-Brown prophecy formula (Spearman, 1910; Brown, 1910) corrects for that:
rfull = 2rhalf ÷ (1 + rhalf). If the halves correlate .70, the full test’s reliability is 2 × .70 ÷ 1.70 = .82.
The general form of the same formula tells you what happens if you lengthen or shorten a test, which you can try with the Spearman-Brown prophecy calculator.
KR-20. Kuder and Richardson (1937) gave formulas for tests whose items are scored right or wrong (1 or 0), such as an ability test. KR-20 is the most used. The item analysis calculator computes KR-20 along with item difficulty and discrimination.
Cronbach’s alpha. Cronbach (1951) gave a general coefficient, alpha, that works for items with more than two response options, such as 5-point Likert items. KR-20 is a special case of alpha, and Cronbach showed alpha is the mean of all possible split-half coefficients. Alpha is the number almost every questionnaire study reports. Two cautions: alpha rises with the number of items, so a long scale can have high alpha even if its items are not very related; and a high alpha does not prove the scale measures only one thing. Thesis students using structural equation modelling report composite reliability alongside alpha, which the composite reliability and AVE calculator handles.
4. Inter-rater reliability
When people score something by judgement (an interview, an assessment centre exercise, a performance appraisal, an essay answer), we need to know whether different raters agree. That is inter-rater reliability.
- For two raters putting people into categories (hire / do not hire), use Cohen’s kappa (Cohen, 1960), which corrects simple percentage agreement for the agreement expected by chance.
- For ratings on a scale (1 to 5) from two or more raters, use the intraclass correlation coefficient (ICC). Shrout and Fleiss (1979) described the main forms, and the form you choose depends on your design. Koo and Li (2016) suggest reading ICC values below .50 as poor, .50 to .75 as moderate, .75 to .90 as good and above .90 as excellent. Try the intraclass correlation calculator, or the rwg and ICC calculator for team-level agreement.
Inter-rater reliability is often lower than students expect. Viswesvaran, Ones and Schmidt (1996) found that the mean inter-rater reliability of supervisors’ ratings of overall job performance was .52. That is one reason why performance appraisal errors and rater training matter so much.
The four types compared (table)
| Type | What is compared | Usual statistic | Main source of error it detects | Workplace example |
|---|---|---|---|---|
| Test-retest | Same test, same people, two occasions | Correlation (coefficient of stability) | Changes over time, memory effects | Numerical reasoning test given twice, four weeks apart |
| Parallel forms | Two equivalent forms, same people | Correlation (coefficient of equivalence) | Differences between item sets | Form A and Form B of a bank’s recruitment test |
| Internal consistency | Items within one test, one sitting | Split-half with Spearman-Brown, KR-20, Cronbach’s alpha | Items that do not measure the same thing | 10-item job satisfaction scale in a thesis |
| Inter-rater | Two or more raters scoring the same people | Cohen’s kappa, ICC | Rater disagreement and bias | Two interviewers rating the same candidates |
What is a good reliability coefficient?
Students often write “reliability must be above .70”. That figure is usually traced to Nunnally’s Psychometric Theory. Lance, Butts and Michels (2006) traced this and other cut-offs to their sources and found they are often cited out of context: Nunnally treated .70 as modest reliability that is acceptable in the early stages of research, and asked for much higher values (around .90) when scores are used to make important decisions about individuals. So:
- For a research questionnaire in a thesis, alpha of .70 or above is the common convention.
- For a test used to hire, promote or reject individual people, aim much higher, around .90.
- Always say which type of reliability you report, because a test can have high internal consistency and poor test-retest reliability, or the other way round.
What lowers reliability?
- Short tests: fewer items means more room for chance.
- A narrow group: if everyone tested is similar (all senior managers), there is little true variance and the coefficient drops.
- Unclear items or instructions, and poor testing conditions.
- Untrained raters with no shared standard.
- Guessing on right/wrong items.
Standard error of measurement (SEM)
Reliability describes a test. The standard error of measurement tells you how much an individual’s score is likely to move because of error. The formula is:
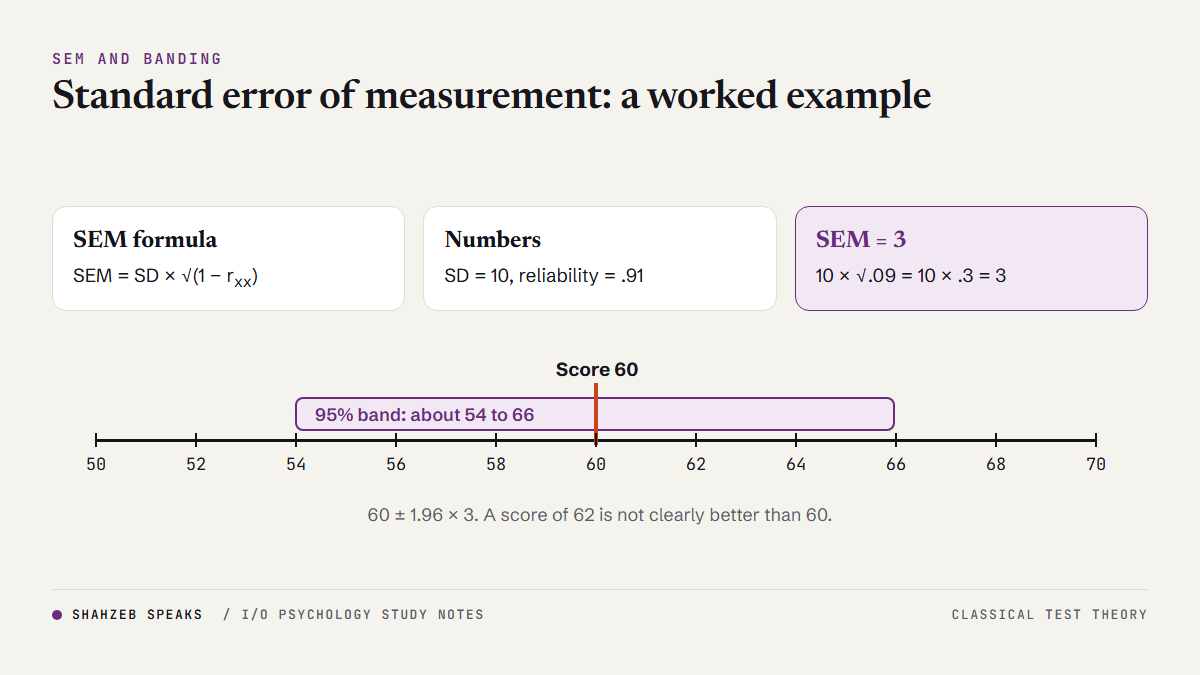
SEM = SD × √(1 − rxx), where SD is the standard deviation of test scores and rxx is the reliability.
Worked example: a selection test has SD = 10 and reliability = .91. SEM = 10 × √.09 = 10 × .3 = 3. A candidate who scores 60 has a 95% confidence band of roughly 60 ± 1.96 × 3, which is about 54 to 66. A second candidate who scores 62 is not clearly better than the first; their bands overlap almost completely.
This is the logic behind banding: treating candidates whose scores fall within a band as equal, instead of ranking 62 above 60 as if the two-point gap were real. You can build bands from your own data with the standard error of measurement and banding calculator.
Reliability vs validity
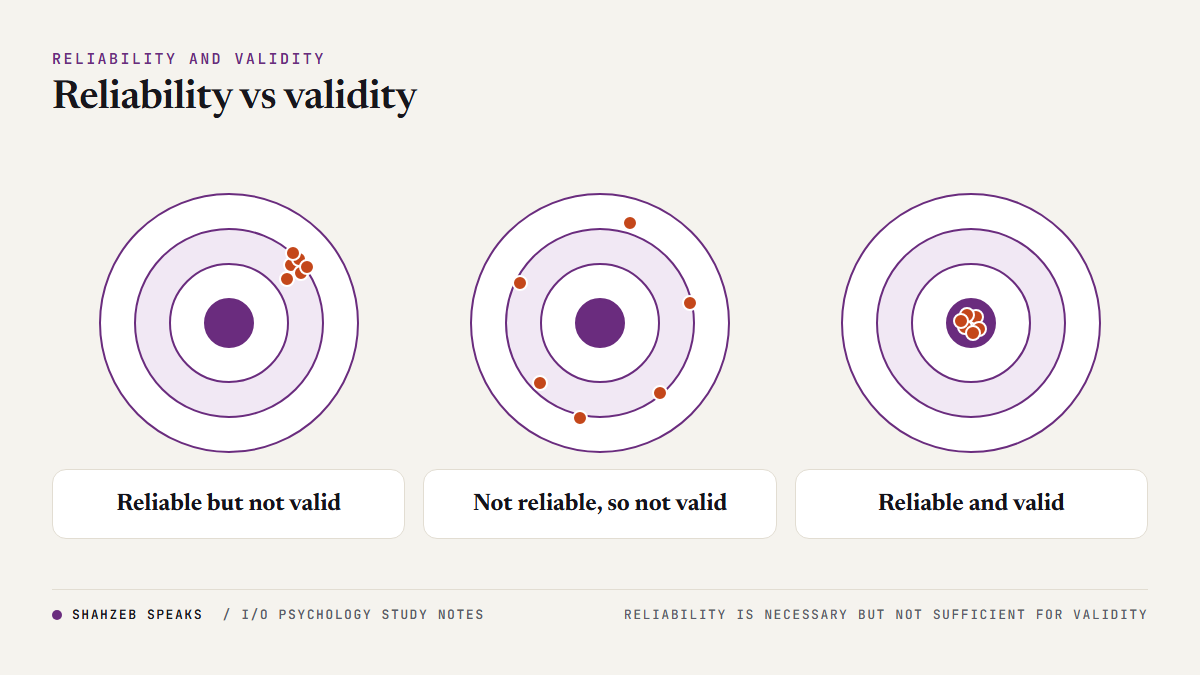
Reliability is about consistency; validity is about whether scores mean what you claim and predict what you need (see validity in employee selection). The classic picture is a target:
- Reliable but not valid: shots grouped tightly, but away from the centre. A consistent typing test used to choose sales managers.
- Not reliable, so not valid: shots scattered everywhere. An unstructured interview where each manager asks different questions.
- Reliable and valid: shots grouped tightly in the centre. A structured interview built from a job analysis, scored by trained interviewers.
The rule to remember: reliability is necessary but not sufficient for validity. An unreliable test cannot be valid, but a reliable test is not automatically valid.
10-mark answer structure
- Definition: reliability is the consistency of test scores; in classical test theory X = T + E, and reliability is the proportion of observed variance that is true variance.
- Test-retest: coefficient of stability; one advantage, one problem (memory, real change).
- Parallel forms: coefficient of equivalence; useful for repeated testing; hard to build.
- Internal consistency: split-half with the Spearman-Brown formula (show the .70 to .82 example), KR-20 (Kuder and Richardson, 1937), Cronbach’s alpha (1951).
- Inter-rater: Cohen’s kappa (1960) and ICC; mention .52 for supervisor ratings (Viswesvaran et al., 1996).
- SEM: formula and one worked line.
- Reliability vs validity: necessary but not sufficient.
- Conclusion: choose the type that matches the error you worry about, and report it by name.
Model opening line: “Reliability refers to the consistency of measurement; because every observed score contains true score and error, psychologists estimate reliability in several ways, each sensitive to a different source of error: time (test-retest), item sets (parallel forms), items within a test (internal consistency) and raters (inter-rater reliability).”
Practice MCQs: reliability in psychological testing
Practice questions written to the published syllabus, not past-paper items.
-
A test is given to the same group twice, six weeks apart, and the scores are correlated. This estimates:
- internal consistency
- test-retest reliability
- inter-rater reliability
- content validity
Show answer
B. Same test, same people, two occasions is test-retest (stability). Internal consistency uses one sitting; inter-rater needs several raters; content validity is about item coverage.
-
The two halves of a test correlate .60. Using the Spearman-Brown formula, the full-test reliability is:
- .60
- .75
- .36
- 1.20
Show answer
B. 2 × .60 ÷ 1.60 = .75. .60 is the uncorrected half correlation, .36 is r squared, and 1.20 forgets the denominator.
-
KR-20 is appropriate for items that are:
- scored right or wrong
- rated on a 7-point Likert scale
- open-ended essays
- rated by two judges
Show answer
A. KR-20 is for dichotomous (1/0) items. Likert items use alpha; essays and judges need inter-rater methods.
-
Which statement about Cronbach’s alpha is correct?
- It proves a scale measures only one construct
- It tends to increase as the number of items increases
- It requires two testing occasions
- It can only be used for right/wrong items
Show answer
B. Longer scales tend to have higher alpha. Alpha does not prove one-dimensionality, needs only one sitting, and works with multi-point items.
-
Two interviewers each classify 50 candidates as “hire” or “do not hire”. The best index of their agreement, corrected for chance, is:
- Pearson’s r
- Cohen’s kappa
- Cronbach’s alpha
- KR-20
Show answer
B. Kappa corrects category agreement for chance (Cohen, 1960). Alpha and KR-20 are internal consistency indices; r suits continuous scores.
-
A test has SD = 15 and reliability = .84. Its standard error of measurement is:
- 2.4
- 6
- 12.6
- 0.4
Show answer
B. 15 × √(1 − .84) = 15 × .4 = 6. 2.4 multiplies by .16 without the square root; 12.6 multiplies by .84; 0.4 forgets the SD.
-
Which of these would most likely LOWER a test’s reliability coefficient?
- Adding more good items
- Testing a group whose members are all very similar
- Training raters on a shared standard
- Clearer instructions
Show answer
B. A narrow group has little true-score variance, so the coefficient drops. The other three usually raise reliability.
-
A typing test gives very consistent scores but is used to select sales managers. The test is best described as:
- valid but not reliable
- reliable but not valid for this use
- neither reliable nor valid
- reliable and valid
Show answer
B. Consistent scores mean reliable; typing is not what sales managers need, so it lacks validity for this use. A test cannot be valid without reliability, so A is impossible.
-
Which is NOT a form of internal consistency reliability?
- Split-half
- KR-20
- Cronbach’s alpha
- Coefficient of stability
Show answer
D. The coefficient of stability is test-retest reliability. The other three all use items from a single administration.
-
Why does the split-half correlation need correcting?
- Because halves are always unequal in difficulty
- Because each half is shorter than the full test, so the correlation underestimates full-test reliability
- Because it measures validity, not reliability
- Because it is affected by memory effects
Show answer
B. Reliability depends on length, and each half has only half the items; Spearman-Brown adjusts for that. Memory effects belong to test-retest designs.
Calculate it yourself
Free reliability tools on this site: item analysis and KR-20, Spearman-Brown, ICC and SEM and banding. For exam revision, the free I/O Psychology Prep app has 410 explained questions and works offline: Get it on Google Play.
More practice: the selection, reliability and validity MCQs.
Questions students ask
What are the 4 types of reliability in psychology?
Test-retest reliability (stability over time), parallel or alternate forms reliability (equivalence of two versions), internal consistency (split-half, KR-20 and Cronbach’s alpha) and inter-rater reliability (agreement between judges, measured with kappa or the ICC).
What is an acceptable Cronbach’s alpha?
For research scales, .70 or above is the common convention. For tests used to make decisions about individuals, such as hiring, much higher values (around .90) are recommended. The .70 figure is often quoted without the context Nunnally gave it.
What is the difference between reliability and validity?
Reliability is consistency: does the test give the same result again? Validity is meaning and usefulness: does the score measure what you claim and predict what you need? A test must be reliable to be valid, but a reliable test can still be invalid for a given use.
Which type of reliability should I report in my thesis?
For a multi-item questionnaire given once, report Cronbach’s alpha for each scale (and composite reliability if you use structural equation modelling). If raters scored anything, add inter-rater reliability. Name the type and give the value for your own sample, not only the original author’s value.
What does the standard error of measurement tell you?
It estimates how far a person’s observed score is likely to be from their true score because of measurement error. It lets you put a confidence band around an individual’s score, which is why it is used for score banding in selection.
Is test-retest reliability the same as stability?
Yes. The correlation from a test-retest study is called the coefficient of stability. Parallel forms reliability gives the coefficient of equivalence.
Practise on your phone
The free I/O Psychology Prep app has 410 explained
questions, flashcards and an exam countdown, and works offline. Get it on Google Play
· About the app
References
- Brown, W. (1910). Some experimental results in the correlation of mental abilities. British Journal of Psychology, 3(3), 296-322. https://doi.org/10.1111/j.2044-8295.1910.tb00207.x
- Cohen, J. (1960). A coefficient of agreement for nominal scales. Educational and Psychological Measurement, 20(1), 37-46. https://doi.org/10.1177/001316446002000104
- Cronbach, L. J. (1951). Coefficient alpha and the internal structure of tests. Psychometrika, 16(3), 297-334. https://doi.org/10.1007/BF02310555
- Koo, T. K., & Li, M. Y. (2016). A guideline of selecting and reporting intraclass correlation coefficients for reliability research. Journal of Chiropractic Medicine, 15(2), 155-163. https://doi.org/10.1016/j.jcm.2016.02.012
- Kuder, G. F., & Richardson, M. W. (1937). The theory of the estimation of test reliability. Psychometrika, 2(3), 151-160. https://doi.org/10.1007/BF02288391
- Lance, C. E., Butts, M. M., & Michels, L. C. (2006). The sources of four commonly reported cutoff criteria: What did they really say? Organizational Research Methods, 9(2), 202-220. https://doi.org/10.1177/1094428105284919
- Nunnally, J. C., & Bernstein, I. H. (1994). Psychometric theory (3rd ed.). McGraw-Hill.
- Shrout, P. E., & Fleiss, J. L. (1979). Intraclass correlations: Uses in assessing rater reliability. Psychological Bulletin, 86(2), 420-428. https://doi.org/10.1037/0033-2909.86.2.420
- Spearman, C. (1910). Correlation calculated from faulty data. British Journal of Psychology, 3(3), 271-295. https://doi.org/10.1111/j.2044-8295.1910.tb00206.x
- Viswesvaran, C., Ones, D. S., & Schmidt, F. L. (1996). Comparative analysis of the reliability of job performance ratings. Journal of Applied Psychology, 81(5), 557-574. https://doi.org/10.1037/0021-9010.81.5.557
Back to the hub: Personnel psychology notes. Related: validity in employee selection, performance appraisal errors, free scales for I/O theses and how to pass psychometric tests.