
I/O research methods cover how studies are designed (experiments, quasi-experiments, correlational surveys), how people are sampled, how measures are checked (reliability such as Cronbach’s alpha, 1951, and construct validity such as Campbell and Fiske’s multitrait-multimethod approach, 1959), how results are analysed (correlation, regression, significance and effect size) and how participants are protected (APA Ethics Code).
This page is for students revising the research methods and statistics part of an I/O psychology course, and for thesis students who want to test themselves before a proposal defence or viva. It gives a short summary, a design comparison table, two worked numbers, a 10-mark answer plan and 25 practice questions with explanations. These are practice questions written to the published syllabus (research methods is the second topic in Punjab University’s Industrial Psychology outline), not past-paper questions.
Several questions ask you to calculate. Each answer shows the working, and links to the free calculators on this site so you can check your own thesis numbers the same way.
Research methods and statistics in 480 words
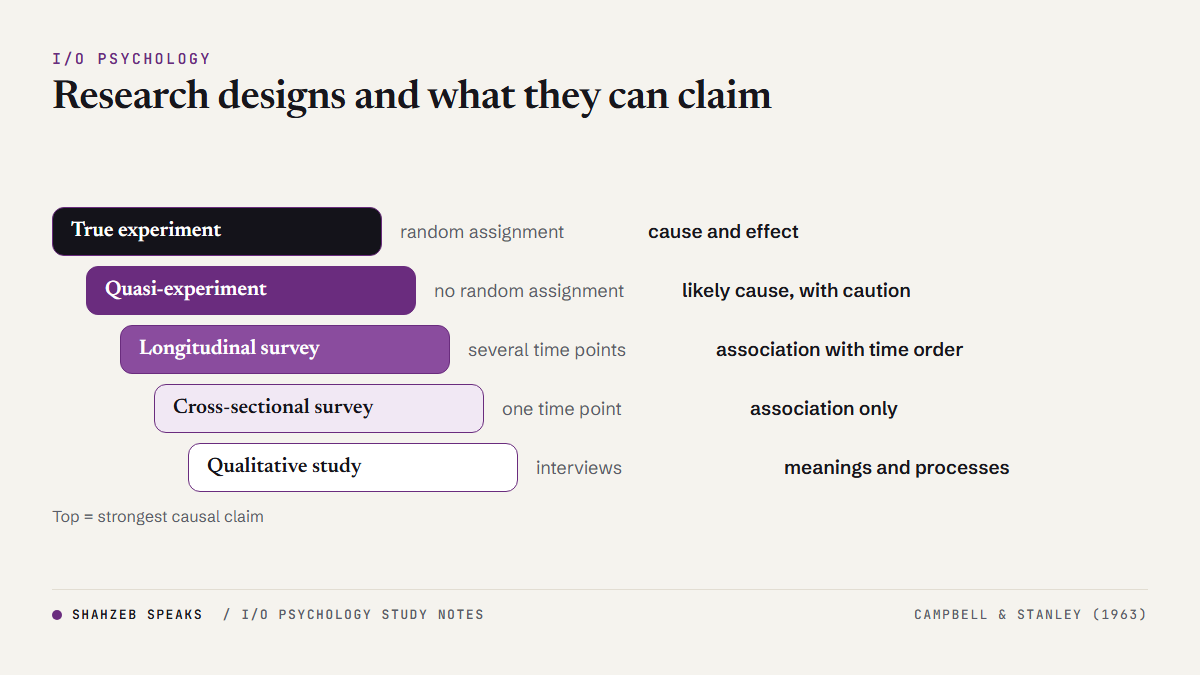
Designs. In a true experiment the researcher manipulates the independent variable and assigns people to conditions at random, which supports causal conclusions. A quasi-experiment compares groups that were not randomly assigned, such as two bank branches, which is common in real organisations but leaves other explanations open. A correlational (survey) study measures variables as they occur; it can be cross-sectional (one time point) or longitudinal (several time points). Campbell and Stanley (1963) listed threats to internal validity such as history, maturation, testing and selection.
Sampling. Probability samples (simple random, stratified, cluster, systematic) give every member of the population a known chance of selection. Non-probability samples (convenience, purposive, snowball, quota) are easier but limit generalisation. Random sampling supports generalisation; random assignment supports causal claims.
Variables. A mediator explains how or why one variable affects another; a moderator changes the strength or direction of a relationship (Baron and Kenny, 1986). Stevens (1946) described four levels of measurement: nominal, ordinal, interval and ratio.
Reliability. Test-retest reliability checks stability over time. Internal consistency is usually reported as Cronbach’s (1951) alpha. Alpha rises with the number of items and a high alpha does not prove a scale measures one thing (Cortina, 1993). The often quoted .70 cut-off comes from Nunnally (1978), who meant it for early-stage research and asked for about .90 when scores are used for important decisions (Lance, Butts and Michels, 2006). The Spearman-Brown formula (Spearman, 1910; Brown, 1910) predicts reliability when a test is lengthened. Agreement between raters is assessed with the intraclass correlation (Shrout and Fleiss, 1979).
Construct validity. Campbell and Fiske (1959) showed how to check that a measure correlates highly with other measures of the same trait (convergent evidence) and weakly with measures of different traits (discriminant evidence).
Analysis. The correlation coefficient r runs from −1 to +1; squaring it gives the proportion of variance shared. Cohen (1992) suggested r = .10, .30 and .50 as small, medium and large effects, and .80 as a reasonable target for statistical power. Regression predicts an outcome from one or more predictors, and R² is the share of variance they explain together. A Type I error is a false positive; a Type II error is a missed real effect. When all variables come from the same people on one questionnaire at one time, common method variance can inflate relationships (Podsakoff et al., 2003).
Ethics. The APA Ethics Code (2017) requires informed consent to research (Standard 8.02), limits deception to cases with strong justification (8.07) and requires debriefing (8.08). In workplace studies, keeping individual answers away from managers is part of protecting confidentiality.
Research designs compared
| Design | Random assignment? | What it can claim | Workplace example | Main limitation |
|---|---|---|---|---|
| True experiment | Yes | Cause and effect | Trainees randomly assigned to e-learning or classroom | Hard to do in real organisations |
| Quasi-experiment | No | Likely cause, with caution | One branch trained, a similar branch not | Groups may differ to begin with |
| Cross-sectional survey | No | Association at one point in time | Workload and burnout survey of nurses | No time order; common method variance |
| Longitudinal survey | No | Association with time order | Engagement measured at hiring, 6 and 12 months | Drop-out over time; costly |
| Qualitative study | No | Meanings and processes | Interviews with call-centre agents about night shifts | Small samples; not for estimating size of effects |
Practice MCQs: research methods and statistics (25 questions)
-
Which design gives the strongest basis for concluding that a new training method caused higher sales?
- A survey asking staff how useful the training was
- Comparing sales before and after training in one branch
- Randomly assigning staff to the new method or the old method and comparing sales
- Interviewing the three best salespeople
Show answer
C. Random assignment makes the groups equal on average, so a difference can be attributed to the method. A measures opinions, B cannot rule out other changes over the same period, and D is a small, selected sample.
-
Random assignment mainly protects ______, while random sampling mainly supports ______.
- Internal validity; generalisation to the population
- Generalisation; internal validity
- Reliability; content validity
- Statistical power; ethics
Show answer
A. Assigning people to conditions by chance supports causal conclusions (internal validity). Selecting people from the population by chance lets you generalise (external validity). B reverses them.
-
A bank trains staff at its Clifton branch and compares their complaint rates with its Gulshan branch, which did not get training. Staff were not randomly assigned. This is a:
- True experiment
- Quasi-experiment
- Case study with no comparison
- Meta-analysis
Show answer
B. There is a comparison group but no random assignment, which defines a quasi-experiment. The branches might differ in customers or managers, so conclusions need care.
-
A student surveys 300 nurses once about workload and burnout. Which conclusion is NOT justified by this design alone?
- Workload and burnout are associated in this sample
- The association has a certain size and direction
- The sample’s average burnout level
- High workload caused the burnout
Show answer
D. A single cross-sectional survey shows association, not cause, and cannot even establish which came first. The other three are things a survey can report.
-
During a six-month training study, the company announces a large pay rise, and performance improves in every group. Campbell and Stanley (1963) would call this threat to internal validity:
- Maturation
- Testing
- History
- Instrumentation
Show answer
C. History is an outside event during the study that could explain the change. Maturation is natural change in participants over time, testing is the effect of taking a pretest, and instrumentation is a change in the measure itself.
-
A university has three faculties of very different sizes. A researcher draws a random sample within each faculty in proportion to its size. This is:
- Stratified random sampling
- Snowball sampling
- Convenience sampling
- Quota sampling
Show answer
A. Dividing the population into groups (strata) and sampling randomly within each is stratified random sampling. Quota sampling also fills groups but without random selection; snowball and convenience samples are non-probability methods.
-
A student studying domestic workers in Lahore cannot find a list of the population, so each participant introduces the next. This is:
- Cluster sampling
- Systematic sampling
- Simple random sampling
- Snowball sampling
Show answer
D. Snowball sampling uses referrals to reach hard-to-find groups. The other three are probability methods that need a sampling frame (a list) to start from.
-
A manager ranks ten job candidates from 1st to 10th. According to Stevens (1946), this is which level of measurement?
- Nominal
- Ordinal
- Interval
- Ratio
Show answer
B. Ranks show order but not equal distances between positions. Nominal is categories without order, interval has equal distances without a true zero, and ratio has a true zero (such as years of experience).
-
A study finds that coaching raises employees’ self-efficacy, and higher self-efficacy in turn raises performance. Self-efficacy is acting as a:
- Mediator
- Moderator
- Control variable
- Dependent variable only
Show answer
A. A mediator explains how the effect happens: coaching → self-efficacy → performance (Baron and Kenny, 1986). A moderator would change the strength of the coaching effect, not carry it.
-
The link between workload and burnout is strong for employees with little supervisor support and weak for those with a lot. Supervisor support is a:
- Mediator
- Dependent variable
- Moderator
- Manipulated independent variable
Show answer
C. A moderator changes the strength or direction of a relationship (when or for whom it holds). Support is not the route by which workload causes burnout, so it is not a mediator.
-
Cronbach’s alpha is an estimate of:
- Test-retest reliability
- Internal consistency reliability
- Inter-rater agreement
- Criterion validity
Show answer
B. Alpha shows how consistently a set of items measures the same thing at one sitting (Cronbach, 1951). Stability over time is test-retest, agreement between judges is inter-rater, and validity is a separate question.
-
Which statement about Cronbach’s alpha is correct, according to Cortina (1993)?
- A high alpha proves a scale is unidimensional
- Alpha is unaffected by the number of items
- Alpha tends to rise as more items are added, so a long scale can have a high alpha even if it measures more than one thing
- Alpha measures validity
Show answer
C. Alpha depends on both the inter-item correlations and the number of items, and a high value does not show unidimensionality. A and B are the two misreadings Cortina warned about, and alpha is a reliability estimate, not validity.
-
The widely quoted “.70 rule” for reliability is usually traced to Nunnally (1978). What did Nunnally actually suggest?
- .70 is enough for every purpose
- .50 is enough for hiring decisions
- Reliability does not matter for applied decisions
- About .70 for early-stage research, but around .90 when scores are used for important decisions about individuals
Show answer
D. Lance, Butts and Michels (2006) showed that the .70 figure is often cited without its context. Nunnally set a higher bar for applied settings where decisions about individuals are made.
-
A 10-item test has a reliability of .60. Using the Spearman-Brown formula, what is the predicted reliability if the test is doubled to 20 parallel items?
- .75
- .60
- 1.20
- .80
Show answer
A. rnew = 2(.60) ÷ (1 + .60) = 1.20 ÷ 1.60 = .75. C forgets the denominator, and reliability can never exceed 1. Try it in the Spearman-Brown prophecy calculator.
-
Two interviewers each rate 40 candidates on a 1-10 scale. Which statistic is most suitable for their agreement on these continuous ratings?
- Cronbach’s alpha of the questionnaire items
- The intraclass correlation coefficient
- A chi-square test of independence
- The mean of the ratings
Show answer
B. The ICC is the standard index of rater reliability for continuous ratings (Shrout and Fleiss, 1979). Alpha is for items, chi-square tests categorical association, and a mean says nothing about agreement. See the intraclass correlation calculator.
-
A new work engagement scale correlates .65 with an established engagement scale and .10 with a social desirability scale. This pattern provides:
- Only test-retest reliability
- Evidence against the new scale
- Convergent and discriminant validity evidence
- Proof the scale is unbiased in every culture
Show answer
C. A high correlation with a measure of the same construct (convergent) and a low one with a different construct (discriminant) is the logic of Campbell and Fiske (1959). It does not test stability over time or cultural fairness.
-
A correlation of r = −.45 between job satisfaction and absence days means:
- Satisfaction causes less absence
- A moderate negative association: more satisfied employees tend to be absent less
- A weak positive association
- No association
Show answer
B. The sign gives the direction (negative) and the size (.45) a moderate strength. A correlation never proves causation, so A goes too far.
-
If r = .40 between a selection test and job performance, what proportion of variance in performance is shared with the test?
- 40%
- 4%
- 80%
- 16%
Show answer
D. The coefficient of determination is r² = .40 × .40 = .16, or 16%. 40% is r itself, which students often report by mistake.
-
According to Cohen’s (1992) guidelines, a correlation of r = .30 is usually described as:
- A medium effect
- A small effect
- A large effect
- No effect
Show answer
A. Cohen proposed .10 as small, .30 as medium and .50 as large for r. He presented these as rough conventions, not strict rules.
-
Branches that give more training hours have higher sales. Which conclusion is most defensible?
- Training causes higher sales
- Higher sales cause more training
- The two are associated, and a third variable such as branch size could explain both
- The finding must be a statistical error
Show answer
C. Correlational data cannot separate the possible directions or rule out a third variable: bigger branches may both train more and sell more. A and B claim a direction the data cannot show.
-
A multiple regression with workload, support and autonomy predicting burnout gives R² = .25. This means:
- Each predictor explains 25% of burnout
- The three predictors together account for 25% of the variance in burnout scores
- Burnout is 25% higher than average
- The correlation between any two predictors is .25
Show answer
B. R² is the share of variance in the outcome explained by all predictors together. It does not split evenly across predictors, and it is not a mean or a predictor intercorrelation.
-
A researcher concludes that a mindfulness programme reduced stress when, in the population, it had no effect. This is a:
- Type I error (false positive)
- Type II error (false negative)
- Sampling frame error
- Correct decision
Show answer
A. Rejecting a true null hypothesis is a Type I error, and its probability is set by alpha (often .05). A Type II error is missing an effect that really exists.
-
Which change will increase the statistical power of a study, other things being equal?
- Using a smaller sample
- Using a stricter alpha such as .001
- Using a less reliable measure
- Using a larger sample
Show answer
D. Larger samples make it more likely to detect a real effect; Cohen (1992) suggested aiming for power of .80. Smaller samples, stricter alpha and unreliable measures all reduce power.
-
A thesis measures leadership, engagement and turnover intention with one self-report questionnaire completed once by the same employees. Which problem should the student discuss, and which remedy fits?
- Common method variance; measure predictors and outcomes at different times or from different sources
- Range restriction; hire more people
- Low power; use a smaller sample
- Deception; stop collecting data
Show answer
A. Using one method, one source and one time point can inflate correlations (Podsakoff et al., 2003). Separating measurement in time or source is one of their recommended remedies. The other options name the wrong problem or the wrong fix.
-
A factory manager offers to let a student run a survey on counterproductive behaviour, but wants to see each worker’s named answers. What should the student do?
- Agree, because the manager gave access
- Refuse to share identifiable answers, collect data with informed, voluntary consent and report only group results
- Collect the data secretly without telling workers it is research
- Ask workers to write their names so results are accurate
Show answer
B. Informed consent (APA Standard 8.02) and confidentiality protect participants, and answers about counterproductive behaviour could harm them if shown to managers. Hidden data collection and named answers break both principles.
Check your thesis numbers
The free research calculators on this site do the working for you: the composite reliability and AVE calculator, the item analysis calculator, the Spearman-Brown calculator and the multiple comparisons calculator. See them all on the free tools page.
Two worked numbers you should be able to do by hand
Examiners like small calculations because they separate memorising from understanding. Learn these two.
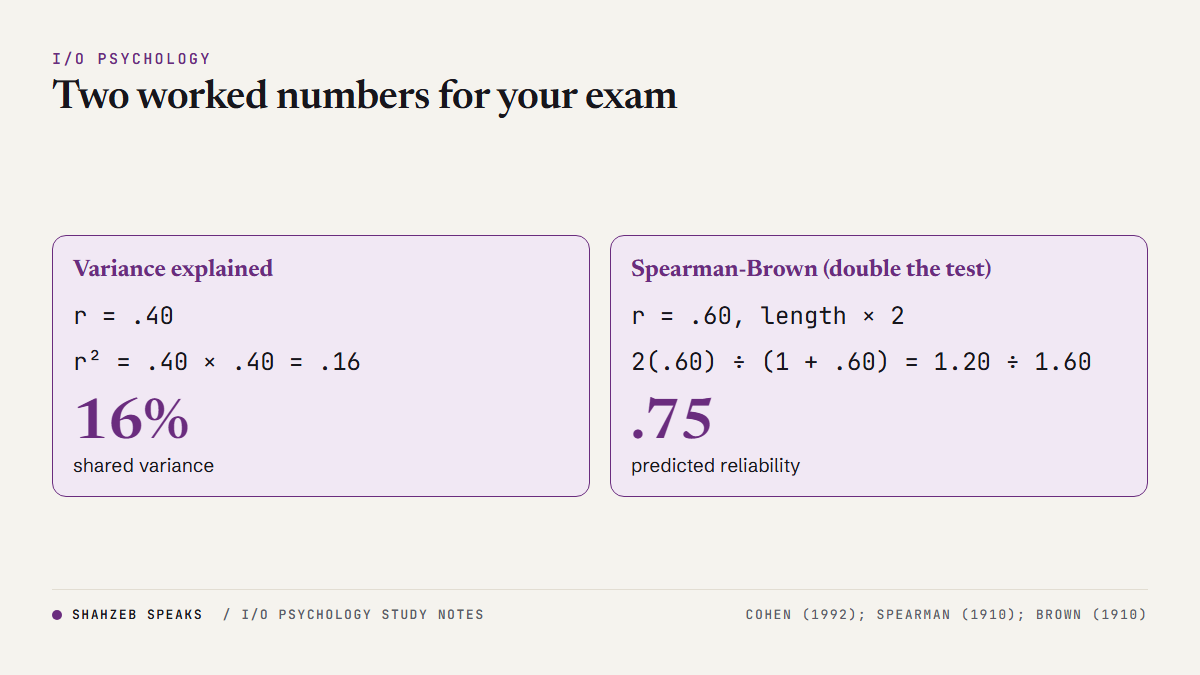
- Variance explained: if r = .40, then r² = .16, so the two variables share 16% of their variance.
- Spearman-Brown: doubling a test whose reliability is .60 gives 2(.60) ÷ (1 + .60) = .75.
How to answer a long question on research methods in I/O psychology
10-mark answer structure: “Discuss the research methods used in industrial and organisational psychology”
- Introduction: I/O psychology is a science-practitioner field, so decisions about people should rest on evidence.
- Experimental methods: lab and field experiments, random assignment, internal validity; one workplace example.
- Quasi-experiments: why they are common in organisations, and the threats they leave open (history, selection; Campbell and Stanley, 1963).
- Correlational and survey methods: cross-sectional versus longitudinal; common method variance (Podsakoff et al., 2003).
- Measurement: reliability (alpha, test-retest, inter-rater) and construct validity (Campbell and Fiske, 1959).
- Analysis: correlation, regression, significance versus effect size (Cohen, 1992); mention meta-analysis for combining studies.
- Ethics: informed consent, confidentiality, deception and debriefing (APA Ethics Code, Standards 8.02, 8.07, 8.08).
- Conclusion: each method trades control for realism; good research combines them.
Model opening line: “Research methods in I/O psychology are the procedures used to collect and analyse evidence about people at work, and they range from tightly controlled experiments that support causal conclusions to field surveys that describe relationships in real organisations.”
Questions students ask
What is the difference between a mediator and a moderator?
A mediator explains how or why an effect happens (X → M → Y). A moderator changes when or for whom the effect holds (the X → Y link is stronger or weaker at different levels of the moderator). The research methods for an I/O thesis guide shows how to test both.
Is a Cronbach’s alpha of .70 good enough?
For a new research scale it is usually accepted, but it is not a universal rule. Nunnally set .70 for early-stage research and a much higher level for decisions about individuals. Report alpha with the number of items, and consider composite reliability too. More in the reliability in psychological testing guide.
Does correlation show causation?
No. A correlation shows that two variables move together. It cannot show which causes which, and a third variable may explain both. Experiments with random assignment are the usual route to causal claims.
Which sampling method should I use for my thesis?
Use a probability method (random, stratified, cluster) if you have a list of the population and want to generalise. Most student theses use convenience or purposive samples; that is acceptable if you state it as a limitation and avoid claims about the whole population.
What is common method bias?
Inflated relationships that come from measuring all variables with the same method, usually one self-report questionnaire at one time. Podsakoff and colleagues (2003) describe procedural and statistical remedies.
Where can I find topics and scales for an I/O thesis?
Start with the I/O psychology thesis topics list and the free scales for I/O theses, which include licence notes.
Practise on your phone
The free I/O Psychology Prep app has 410 explained
questions, flashcards and an exam countdown, and works offline. Get it on Google Play
· About the app
References
- American Psychological Association. (2017). Ethical principles of psychologists and code of conduct (2002, amended effective June 1, 2010, and January 1, 2017). https://www.apa.org/ethics/code
- Baron, R. M., & Kenny, D. A. (1986). The moderator–mediator variable distinction in social psychological research: Conceptual, strategic, and statistical considerations. Journal of Personality and Social Psychology, 51(6), 1173–1182. https://doi.org/10.1037/0022-3514.51.6.1173
- Brown, W. (1910). Some experimental results in the correlation of mental abilities. British Journal of Psychology, 3(3), 296–322. https://doi.org/10.1111/j.2044-8295.1910.tb00207.x
- Campbell, D. T., & Fiske, D. W. (1959). Convergent and discriminant validation by the multitrait-multimethod matrix. Psychological Bulletin, 56(2), 81–105. https://doi.org/10.1037/h0046016
- Campbell, D. T., & Stanley, J. C. (1963). Experimental and quasi-experimental designs for research. Rand McNally.
- Cohen, J. (1992). A power primer. Psychological Bulletin, 112(1), 155–159. https://doi.org/10.1037/0033-2909.112.1.155
- Cortina, J. M. (1993). What is coefficient alpha? An examination of theory and applications. Journal of Applied Psychology, 78(1), 98–104. https://doi.org/10.1037/0021-9010.78.1.98
- Cronbach, L. J. (1951). Coefficient alpha and the internal structure of tests. Psychometrika, 16(3), 297–334. https://doi.org/10.1007/BF02310555
- Lance, C. E., Butts, M. M., & Michels, L. C. (2006). The sources of four commonly reported cutoff criteria: What did they really say? Organizational Research Methods, 9(2), 202–220. https://doi.org/10.1177/1094428105284919
- Nunnally, J. C. (1978). Psychometric theory (2nd ed.). McGraw-Hill.
- Podsakoff, P. M., MacKenzie, S. B., Lee, J.-Y., & Podsakoff, N. P. (2003). Common method biases in behavioral research: A critical review of the literature and recommended remedies. Journal of Applied Psychology, 88(5), 879–903. https://doi.org/10.1037/0021-9010.88.5.879
- Shrout, P. E., & Fleiss, J. L. (1979). Intraclass correlations: Uses in assessing rater reliability. Psychological Bulletin, 86(2), 420–428. https://doi.org/10.1037/0033-2909.86.2.420
- Spearman, C. (1910). Correlation calculated from faulty data. British Journal of Psychology, 3(3), 271–295. https://doi.org/10.1111/j.2044-8295.1910.tb00206.x
- Stevens, S. S. (1946). On the theory of scales of measurement. Science, 103(2684), 677–680. https://doi.org/10.1126/science.103.2684.677
More practice: return to the I/O psychology MCQs hub, or try the selection, reliability and validity MCQs and the job attitudes MCQs. For the measurement side of selection, read types of validity in employee selection.