
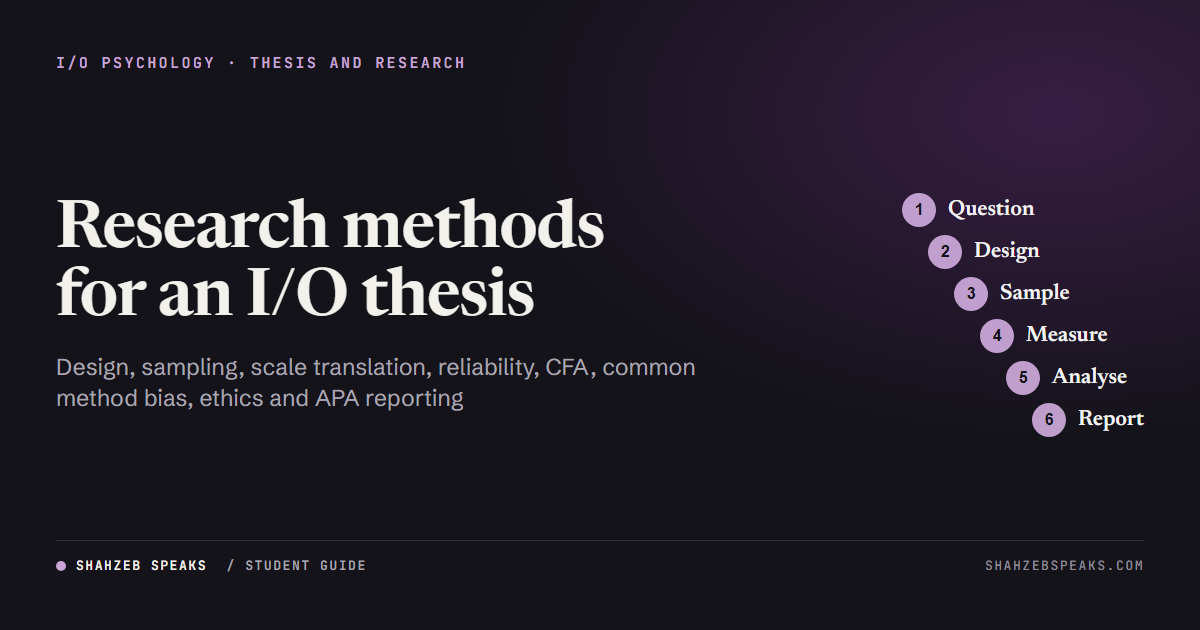
An I/O psychology thesis usually follows nine steps: write a clear research question, choose a design (often a survey), plan sampling and sample size with a power analysis, choose or translate scales, check reliability and validity (alpha or omega, CFA), reduce common method bias, run the right analysis (correlation, regression, t-test or ANOVA, mediation), follow research ethics, and report everything in APA style.
This guide is for BS, MS and MPhil students in psychology, HRM and business who are planning a quantitative I/O thesis, and for anyone answering an exam question on research methods in I/O psychology. It goes through each step with the decisions examiners ask about in a viva, the published rules of thumb (with their sources), and links to free calculators for the numbers. Topic ideas are in the I/O psychology thesis topics guide, and scales with their licence status are in scales for I/O psychology theses.
Step 1: Turn a topic into a research question
A topic (“job stress in nurses”) is not a question. A research question names the variables, the people and the relationship: “Does workload predict burnout among nurses in public hospitals in Karachi, and does supervisor support weaken this link?” From that question come four kinds of variables:
- Predictor (independent variable): workload.
- Outcome (dependent variable): burnout.
- Moderator: a variable that changes the strength of the link (supervisor support).
- Mediator: a variable that explains the link (for example, emotional exhaustion between workload and turnover intention).
Write one hypothesis per relationship, in a testable form: “H1: Workload will be positively related to burnout.” Avoid more than six or seven hypotheses in a BS thesis; each needs its own analysis and discussion.
Step 2: Choose a research design
| Design | What it can tell you | Main weakness | Thesis example |
|---|---|---|---|
| Cross-sectional survey | Whether variables are related at one point in time | Cannot show cause; prone to common method bias | Job satisfaction and turnover intention in bank officers |
| Time-lagged survey | Whether a predictor measured earlier relates to an outcome measured later | Drop-out between waves; still not a true experiment | Abusive supervision at time 1, CWB four weeks later |
| Group comparison | Whether groups differ on a variable | Groups may differ on other things too | Burnout in public vs private school teachers |
| Experiment or vignette study | Cause and effect, if participants are randomly assigned | Artificial setting; harder to run in organisations | Effect of a structured vs unstructured interview description on fairness ratings |
| Quasi-experiment | Change after a real intervention, compared with a group that did not get it | No random assignment | Stress before and after a training programme in two call centres |
Most student theses use a cross-sectional survey because it is fast and cheap. That is acceptable if you write “related to”, not “causes”, in your conclusions.
Step 3: Sampling and sample size
Sampling method
Probability sampling (simple random, stratified, cluster) gives every member of the population a known chance of selection, so results generalise better. Non-probability sampling (convenience, purposive, snowball) is what most theses actually use, because you can only reach the organisations that agree. If you use convenience sampling, say so clearly, describe the sample in detail (sector, city, job levels, gender, tenure), report the response rate, and list it as a limitation.
How many respondents?
Base the number on a power analysis, not on a habit. Cohen (1992) gave conventional effect sizes and the sample sizes needed for .80 power at alpha = .05. For a correlation, the usual figures from his table are about 85 people for a medium effect (r = .30), and about 783 for a small one (r = .10). The free program G*Power (Faul et al., 2007) does these calculations for correlations, regression, t-tests and ANOVA.
A common mistake in South Asian theses is to use the Krejcie and Morgan (1970) table (for example, 384 for a very large population) as the “required” sample. That table is for estimating a proportion in a population with a set margin of error. It does not tell you whether you have enough power to test a correlation or a regression. Use it only if your aim really is to estimate a percentage.
Add 10% to 20% to your target to allow for incomplete questionnaires, and plan more if you will run a CFA or a model with many paths.
Step 4: Choose, translate and adapt your scales
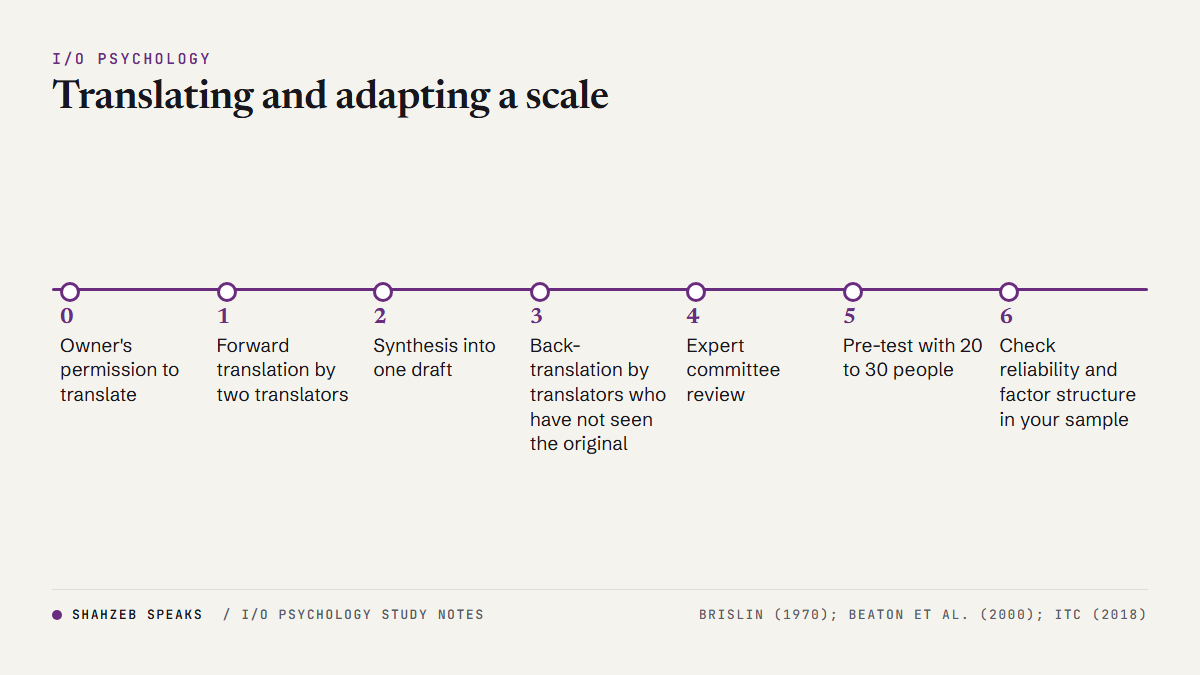
Use established scales with published reliability and validity, and check the licence on the owner’s site (see scales for I/O psychology theses). If your respondents are more comfortable in Urdu, Hindi, Filipino or another language, you need a proper adaptation, not a quick translation:
- Forward translation by at least two bilingual translators working separately.
- Synthesis of their versions into one draft.
- Back-translation into English by translators who have not seen the original. Brislin (1970) showed that equivalence between versions can be evaluated by comparing meaning and responses.
- Expert committee review of all versions, to fix items whose meaning shifted.
- Pre-test with 20 to 30 people from the target group, asking them what each item means to them.
These stages follow Beaton, Bombardier, Guillemin and Ferraz (2000). The International Test Commission’s guidelines (2018) go further: 18 guidelines in six groups (pre-condition, test development, confirmation, administration, scoring and interpretation, documentation). The first pre-condition is getting permission from the owner to translate. Report every step in your method chapter.
Step 5: Check reliability and validity
Reliability
- Report Cronbach’s alpha (Cronbach, 1951) for each scale and each subscale in your own sample. Hayes and Coutts (2020) recommend McDonald’s omega as a better estimate and show how to compute it in SPSS with a macro. Many examiners now ask for both.
- Use the item analysis calculator to find items with low item-total correlations before you decide whether to drop any. Report any dropped item and the reason.
- If you shorten a scale, the Spearman-Brown calculator shows what length does to reliability.
Confirmatory factor analysis (CFA) basics
CFA tests whether your items load on the factors the scale is supposed to have. Report the chi-square with its degrees of freedom, and fit indices. Hu and Bentler (1999) suggested cut-offs close to .95 for CFI and TLI, close to .08 for SRMR and close to .06 for RMSEA as signs of relatively good fit, and recommended reporting SRMR together with one other index. Treat these as guides, not laws.
From the standardised loadings, compute composite reliability (CR) and average variance extracted (AVE) with the free composite reliability and AVE calculator. For discriminant validity, Fornell and Larcker (1981) compared each construct’s AVE with its shared variance with other constructs. Henseler, Ringle and Sarstedt (2015) showed by simulation that this criterion often misses problems in variance-based SEM and proposed the heterotrait-monotrait ratio (HTMT) instead, so report HTMT if you use PLS-SEM.
Agreement and team-level data
If several raters judge the same people, or you average team members’ answers into a team score, you need agreement and reliability indices. James, Demaree and Wolf (1984) introduced rwg for within-group agreement. LeBreton and Senter (2008) answer 20 common questions about agreement and reliability indices. For intraclass correlations, Koo and Li (2016) suggest that values below .50 are poor, .50 to .75 moderate, .75 to .90 good and above .90 excellent, and stress that you must report which ICC form you used. The rwg and ICC calculator and the intraclass correlation calculator compute these.
Step 6: Reduce common method bias
When the same person answers every question at the same time, part of the correlation between your variables may come from the method (mood, wanting to look consistent, the same answer format) rather than from a real relationship. Podsakoff, MacKenzie, Lee and Podsakoff (2003) reviewed the sources of this bias and the remedies. The procedural remedies are the ones a student can actually use:
- Different sources: employees rate their satisfaction; supervisors rate their performance or OCB.
- Time separation: measure the predictor and the outcome a few weeks apart.
- Anonymity: tell respondents there are no right or wrong answers and that no one at work will see their answers.
- Clear items and varied formats, and placing the predictor and outcome in different sections.
Statistical checks come after. Harman’s single-factor test is popular but Podsakoff et al. (2003) noted it does not control for method variance. Lindell and Whitney (2001) proposed a marker variable approach: include a variable that theory says should be unrelated to your main variables and use it to adjust the correlations.
Step 7: Choose the right analysis
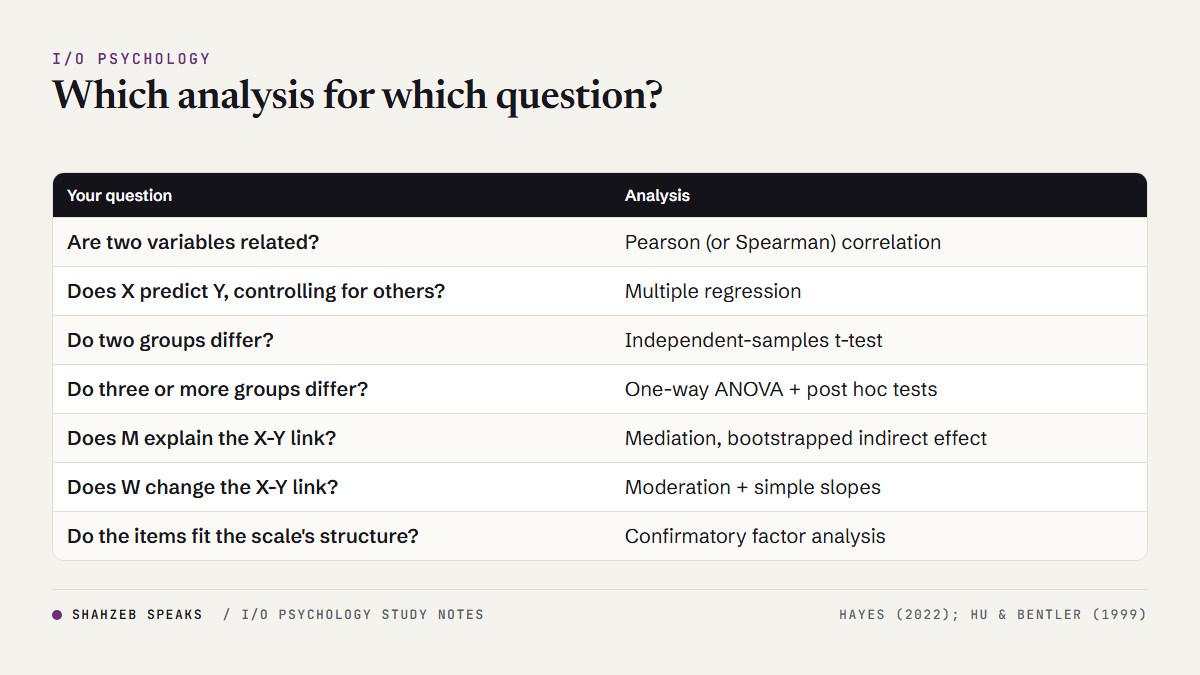
| Your question | Analysis | What to report |
|---|---|---|
| Are two variables related? | Pearson correlation (Spearman if data are ranked or badly skewed) | r, p, 95% CI, N |
| Does X predict Y, controlling for others? | Multiple regression (hierarchical if you add blocks) | B, SE, beta, p, R squared and change in R squared |
| Do two groups differ? | Independent-samples t-test | t, df, p, means, SDs, Cohen’s d |
| Do three or more groups differ? | One-way ANOVA with post hoc tests | F, df, p, eta squared, post hoc results |
| Does M explain the X-Y link? | Mediation with a bootstrapped indirect effect | Indirect effect, bootstrap 95% CI |
| Does W change the X-Y link? | Moderation (interaction term) with simple slopes | Interaction B, p, simple slopes, a plot |
| Do the items fit the scale’s structure? | Confirmatory factor analysis | Chi-square, df, CFI, TLI, RMSEA, SRMR, loadings |
On mediation: Baron and Kenny (1986) set out the classic steps, but the approach now taught in most methods courses tests the indirect effect directly with bootstrapped confidence intervals, as in Hayes (2022) and his PROCESS macro for SPSS. If your thesis runs many tests (for example, comparing many departments), read about the false-positive problem and use the free multiple comparisons calculator.
Step 8: Research ethics in organisations
Workplace research has risks that classroom surveys do not: a manager might want to see who said what. Your university’s ethics or research committee will expect, at least:
- Informed consent: a first page that explains the purpose, the time needed, that taking part is voluntary, that people may stop at any point, and who to contact.
- Anonymity and confidentiality: no names or employee numbers unless you need to match two waves (then use a self-made code). Only report group results, and never small groups that make people identifiable.
- Organisational permission: a letter from HR or management, but with a clear agreement that the organisation receives only a summary, never individual answers.
- Sensitive variables: questions about CWB, harassment or mental health need extra care, a statement of where to get help, and secure data storage.
- Scale permissions and correct citation of every instrument.
Step 9: Report in APA style
Use the current APA Publication Manual (7th edition, 2020) for format, and the Journal Article Reporting Standards (Appelbaum et al., 2018) as a checklist for what your method and results must contain. A results paragraph should give the statistic, degrees of freedom, exact p-value, effect size and confidence interval. An example of the form (numbers are illustrative only): “Workload was positively related to burnout, r(198) = .41, p < .001, 95% CI [.29, .52].” Report the descriptive statistics, correlations and reliabilities in one table before the hypothesis tests.
For more on reliability concepts, see reliability in psychological testing, and on validity, validity in employee selection.
10-mark answer structure: “Explain the research process in I/O psychology”
- Introduction (1 mark): I/O psychology is a science-practice field; research decides which HR practices work.
- Question and hypotheses (1 mark): variables, predictor, outcome, mediator, moderator.
- Design (2 marks): survey, time-lagged, experiment, quasi-experiment; one strength and weakness each.
- Sampling (1 mark): probability vs non-probability; power analysis (Cohen, 1992).
- Measurement (2 marks): reliability (alpha, omega), validity (CFA), translation with back-translation (Brislin, 1970).
- Analysis (1 mark): correlation, regression, t-test or ANOVA, mediation.
- Ethics (1 mark): consent, anonymity, confidentiality, organisational permission.
- Conclusion (1 mark): limits of cross-sectional surveys and common method bias (Podsakoff et al., 2003).
Model opening line: “Research in I/O psychology moves from a precise question to a design, a sample, reliable and valid measures, an appropriate analysis and ethical reporting, and each step limits what the findings can claim.”
Practice MCQs: research methods for an I/O thesis
Practice questions written to the published syllabus, not past-paper questions.
-
A student finds that supervisor support weakens the link between workload and burnout. Supervisor support is acting as a:
- Mediator
- Moderator
- Dependent variable
- Control variable
Show answer
B. A moderator changes the strength or direction of a relationship. A mediator would explain how workload leads to burnout; the dependent variable is burnout; a control variable is held constant, not tested as a condition of the effect.
-
A student uses the Krejcie and Morgan table to set N = 384 for a correlation study. What is the main problem?
- 384 is always too small
- The table is for estimating a population proportion, not for the power of a correlation test
- The table only works for experiments
- Nothing; it is the standard rule for any study
Show answer
B. The table gives sample sizes for estimating a proportion with a set margin of error. Power for a correlation depends on the expected effect size, alpha and power, which a power analysis (Cohen, 1992; G*Power) handles.
-
Which step comes after forward translation and synthesis when adapting a scale?
- Back-translation by translators who have not seen the original
- Publishing the translated scale
- Deleting items with low alpha
- Running the main survey
Show answer
A. Back-translation checks whether meaning survived, before expert review and pre-testing. Publishing, deleting items and running the main study come much later.
-
How many guidelines are in the second edition of the ITC Guidelines for Translating and Adapting Tests?
- 6
- 12
- 18
- 24
Show answer
C. There are 18 guidelines in six categories. Six is the number of categories, not guidelines.
-
Which of these is NOT a procedural remedy for common method bias?
- Getting the outcome from a different source
- Measuring predictor and outcome at different times
- Assuring anonymity
- Running Harman’s single-factor test
Show answer
D. Harman’s test is a statistical check, done after data collection, and Podsakoff et al. (2003) noted it does not control for method variance. The other three are design steps that reduce the bias.
-
Hu and Bentler (1999) suggested which approximate cut-off for RMSEA as a sign of relatively good fit?
- .01
- .06
- .15
- .50
Show answer
B. They suggested a value close to .06 for RMSEA (with about .95 for CFI and TLI and about .08 for SRMR). The other values are not their recommendations.
-
A student wants to test whether emotional exhaustion explains why workload leads to turnover intention. Which analysis is best?
- Independent-samples t-test
- Mediation with a bootstrapped indirect effect
- One-way ANOVA
- Chi-square test
Show answer
B. “Explains why” is mediation, tested with a bootstrapped confidence interval for the indirect effect (Hayes, 2022). t-tests and ANOVA compare groups; chi-square is for categorical counts.
-
According to Koo and Li (2016), an ICC of .80 indicates:
- Poor reliability
- Moderate reliability
- Good reliability
- Excellent reliability
Show answer
C. Their bands are below .50 poor, .50 to .75 moderate, .75 to .90 good and above .90 excellent, so .80 is good.
-
Henseler, Ringle and Sarstedt (2015) proposed HTMT because:
- Cronbach’s alpha cannot be computed in PLS
- The Fornell-Larcker criterion often failed to detect a lack of discriminant validity in their simulations
- CFA needs too many respondents
- APA style requires it
Show answer
B. Their simulation showed Fornell-Larcker and cross-loadings did not reliably detect discriminant validity problems. HTMT is not about alpha, sample size or APA style.
-
An HR manager offers to help with data collection if the student shares each employee’s answers. What should the student do?
- Agree, since the organisation gave access
- Share only names of those who scored high on CWB
- Agree to share only group-level summaries, as stated in the consent form
- Share answers after the thesis is approved
Show answer
C. Confidentiality means the organisation gets only group summaries, never individual answers. Sharing individual data, at any time, breaks the promise in the consent form and can harm respondents.
Free calculators for your thesis
Run the numbers this page talks about with the free composite reliability and AVE calculator, intraclass correlation calculator, rwg and ICC calculator, item analysis calculator, Spearman-Brown calculator and multiple comparisons calculator.
Questions students ask
What is the best research design for an I/O psychology thesis?
For most BS and MS theses, a survey is the practical choice. A time-lagged survey (predictor first, outcome a few weeks later) or using a second source for the outcome makes it much stronger. An experiment is best for cause and effect but is harder to run inside organisations.
How many participants do I need for my thesis?
Run a power analysis. Using Cohen’s (1992) conventions at .80 power and alpha = .05, a correlation needs about 85 people for a medium effect and about 783 for a small one. G*Power calculates this for regression, t-tests and ANOVA. Add extra for incomplete responses.
Is back-translation enough to adapt a scale?
No. Back-translation is one step. Beaton et al. (2000) also include synthesis, expert committee review and pre-testing, and you still need to check reliability and factor structure in your own sample. Get the owner’s permission to translate first.
What alpha value is acceptable?
Many methods texts use .70 as a common rule of thumb for research scales, but the value depends on the number of items and the purpose. Report omega as well (Hayes and Coutts, 2020), and explain low values honestly rather than deleting items just to raise alpha.
Should I use Baron and Kenny or PROCESS for mediation?
Report the indirect effect with a bootstrapped confidence interval, as in Hayes (2022) and his PROCESS macro. You can mention the Baron and Kenny (1986) logic, but the bootstrapped test is the main evidence.
How do I reduce common method bias in a one-time survey?
Assure anonymity, keep items clear, separate predictor and outcome sections, vary answer formats, and if possible include a marker variable (Lindell and Whitney, 2001). State the risk as a limitation.
Practise on your phone
The free I/O Psychology Prep app has 410 explained
questions, flashcards and an exam countdown, and works offline. Get it on Google Play
· About the app
References
- American Psychological Association. (2020). Publication manual of the American Psychological Association (7th ed.). https://doi.org/10.1037/0000165-000
- Appelbaum, M., Cooper, H., Kline, R. B., Mayo-Wilson, E., Nezu, A. M., & Rao, S. M. (2018). Journal article reporting standards for quantitative research in psychology: The APA Publications and Communications Board task force report. American Psychologist, 73(1), 3-25. https://doi.org/10.1037/amp0000191
- Baron, R. M., & Kenny, D. A. (1986). The moderator-mediator variable distinction in social psychological research: Conceptual, strategic, and statistical considerations. Journal of Personality and Social Psychology, 51(6), 1173-1182. https://doi.org/10.1037/0022-3514.51.6.1173
- Beaton, D. E., Bombardier, C., Guillemin, F., & Ferraz, M. B. (2000). Guidelines for the process of cross-cultural adaptation of self-report measures. Spine, 25(24), 3186-3191. https://doi.org/10.1097/00007632-200012150-00014
- Brislin, R. W. (1970). Back-translation for cross-cultural research. Journal of Cross-Cultural Psychology, 1(3), 185-216. https://doi.org/10.1177/135910457000100301
- Cohen, J. (1992). A power primer. Psychological Bulletin, 112(1), 155-159. https://doi.org/10.1037/0033-2909.112.1.155
- Cronbach, L. J. (1951). Coefficient alpha and the internal structure of tests. Psychometrika, 16(3), 297-334. https://doi.org/10.1007/BF02310555
- Faul, F., Erdfelder, E., Lang, A.-G., & Buchner, A. (2007). G*Power 3: A flexible statistical power analysis program for the social, behavioral, and biomedical sciences. Behavior Research Methods, 39(2), 175-191. https://doi.org/10.3758/BF03193146
- Fornell, C., & Larcker, D. F. (1981). Evaluating structural equation models with unobservable variables and measurement error. Journal of Marketing Research, 18(1), 39-50. https://doi.org/10.1177/002224378101800104
- Hayes, A. F. (2022). Introduction to mediation, moderation, and conditional process analysis: A regression-based approach (3rd ed.). Guilford Press.
- Hayes, A. F., & Coutts, J. J. (2020). Use omega rather than Cronbach’s alpha for estimating reliability. But… Communication Methods and Measures, 14(1), 1-24. https://doi.org/10.1080/19312458.2020.1718629
- Henseler, J., Ringle, C. M., & Sarstedt, M. (2015). A new criterion for assessing discriminant validity in variance-based structural equation modeling. Journal of the Academy of Marketing Science, 43(1), 115-135. https://doi.org/10.1007/s11747-014-0403-8
- Hu, L., & Bentler, P. M. (1999). Cutoff criteria for fit indexes in covariance structure analysis: Conventional criteria versus new alternatives. Structural Equation Modeling, 6(1), 1-55. https://doi.org/10.1080/10705519909540118
- International Test Commission. (2018). ITC guidelines for translating and adapting tests (second edition). International Journal of Testing, 18(2), 101-134. https://doi.org/10.1080/15305058.2017.1398166
- James, L. R., Demaree, R. G., & Wolf, G. (1984). Estimating within-group interrater reliability with and without response bias. Journal of Applied Psychology, 69(1), 85-98. https://doi.org/10.1037/0021-9010.69.1.85
- Koo, T. K., & Li, M. Y. (2016). A guideline of selecting and reporting intraclass correlation coefficients for reliability research. Journal of Chiropractic Medicine, 15(2), 155-163. https://doi.org/10.1016/j.jcm.2016.02.012
- Krejcie, R. V., & Morgan, D. W. (1970). Determining sample size for research activities. Educational and Psychological Measurement, 30(3), 607-610. https://doi.org/10.1177/001316447003000308
- LeBreton, J. M., & Senter, J. L. (2008). Answers to 20 questions about interrater reliability and interrater agreement. Organizational Research Methods, 11(4), 815-852. https://doi.org/10.1177/1094428106296642
- Lindell, M. K., & Whitney, D. J. (2001). Accounting for common method variance in cross-sectional research designs. Journal of Applied Psychology, 86(1), 114-121. https://doi.org/10.1037/0021-9010.86.1.114
- Podsakoff, P. M., MacKenzie, S. B., Lee, J.-Y., & Podsakoff, N. P. (2003). Common method biases in behavioral research: A critical review of the literature and recommended remedies. Journal of Applied Psychology, 88(5), 879-903. https://doi.org/10.1037/0021-9010.88.5.879
This post is part of the I/O psychology thesis topics hub. Related: scales for I/O theses, Meyer and Allen’s commitment model, job satisfaction measures and the research methods MCQs. Students in Pakistan can also read about industrial psychology in Pakistan.